摘要:
mounted(){this.resizefun=()=˃{this.$echarts.init(document.getElementById('myChart')).resize()};window.addEventListener('ssi
<template>
  <div     :style="{ '100%', height: '350px'}"></div>
</template>
mounted() {
  this.resizefun = ()=>{
    this.$echarts.init(document.getElementById('myChart')).resize()
  };
  window.addEventListener('resize',this.resizefun);
}
//移除事件监听
beforeDestroy() {
window.removeEventListener('resize', this.resizefun);
this.resizefun = null
}// 基于准备好的dom,初始化echarts实例
var myChart = this.$echarts.init(document.getElementById('myChart'));
// 绘制图表
myChart.setOption({
tooltip : {
trigger: 'axis',
axisPointer : { // 坐标轴指示器,坐标轴触发有效
type : 'shadow' // 默认为直线,可选为:'line' | 'shadow'
}
},
legend: {
x:'left',
icon: "roundRect",
data:['交易金额','交易笔数']
},
toolbox: {
show : false,
orient: 'vertical',
x: 'right',
y: 'center',
feature : {
mark : {show: true},
dataView : {show: true, readOnly: false},
magicType : {show: true, type: ['line', 'bar', 'stack', 'tiled']},
restore : {show: true},
saveAsImage : {show: true}
}
},
calculable : true,
xAxis : [
{
type : 'category',
data: [...this.dates]
}
],
yAxis : [
{
type : 'value',
splitLine:{
show:true,
lineStyle:{
type:'dashed'
}
}
}
],
series : [
{
name:'交易金额',
type:'bar',
barWidth: 10,
itemStyle: {
normal: {
color: '#2464fc',
barBorderRadius:[10, 10, 0, 0],
}
},
data:[...this.amounts],
},
{
name:'交易笔数',
type: "line",
smooth:true,//平滑曲线
itemStyle: {
normal: {
color: '#c23531'
}
},
data:[...this.counts],
},
]
});
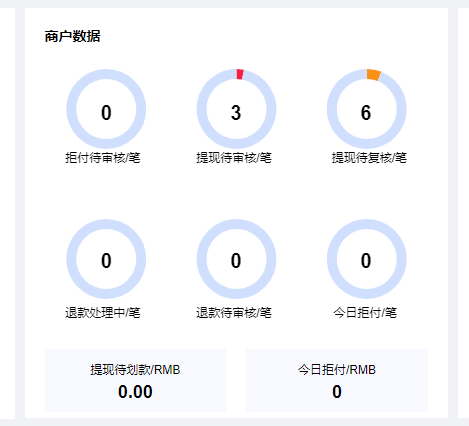
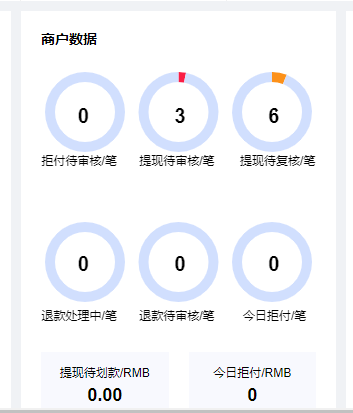
屏幕放大: 屏幕缩小: