摘要:
呈现:饼图:目录结构:˂!
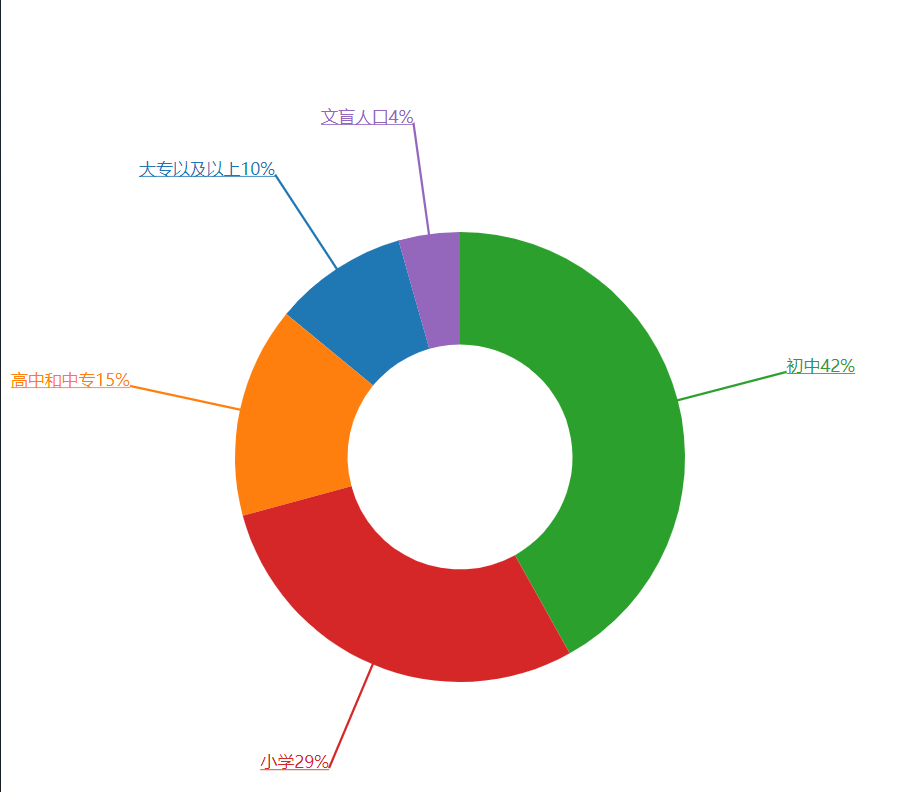
效果图:
饼状图:
目录结构:


<!DOCTYPE html>
<html lang="en">
<head>
    <meta charset="UTF-8">
    <link href="http://t.zoukankan.com/css/style.css" media="screen" rel="stylesheet" type="text/css"/>
    <title>Linechart1</title>
</head>
<body>
    <div id="container"></div>

    <script src="https://d3js.org/d3.v5.min.js"></script>
    <script src="http://t.zoukankan.com/js/index.js"></script>
</body>
</html>/*svg .path{*/ /*fill:#339999;*/ /*}*/ /*svg g path:hover {*/ /*cursor: pointer;*/ /*fill: #66cccc;*/ /*}*/
d3.csv("Data/data.csv",function (d) {
    return {
        education:d.education,
        population:+d.population,
    }
}).then(data=>{
    console.log(data);
    var sum=d3.sum(data.map(function (d) {
        return d.population
    }))

    for(i in data){
        data[i].Percentage=(data[i].population/sum*100).toFixed(0)+"%";
    }
    console.log(data);

    var width=800,
        height=800,
        margin={"left":30,"top":30,"right":30,"bottom":30},
        svg_width=width+margin.left+margin.right,
        svg_height=height+margin.top+margin.bottom,
        font_size=15;

    var svg=d3.select("#container")
        .append("svg")
        .attr("width",width)
        .attr("height",height)


    var Pie=svg.append("g")
        .attr("transform","translate("+width/2+","+height/2+")")

    var arc_generator=d3.arc()
        .innerRadius(width/8)
        .outerRadius(width/4)
        // .startAngle(0)
        // .endAngle(120*Math.PI/180);

    var angle_data=d3.pie()
        .value(function (d) {
            return d.population;
        })
    console.log(angle_data(data));

    var color=d3.schemeCategory10;
    console.log(color)

    //生成内部圆环
    Pie.selectAll("path")
        .data(angle_data(data))
        .enter()
        .append("path")
        .attr("d",arc_generator)
        .style("fill",function (d,i) {
            return color[i];
        })
        .attr("class",".path")

    //标注
    var arc_label=d3.arc()
        .innerRadius(width/4)
        .outerRadius(width/2)

    Pie.selectAll(".arc_label")
        .data(angle_data(data))
        .enter()
        .append("path")
        .attr("d",arc_label)
        .attr("class",".arc_label")
        .style("fill","none")

    //画标注线
    function line_label(angle_data) {
        var str=""
        var i=-0;
        for (d in angle_data){
            str="M"+arc_generator.centroid(angle_data[d])[0]+","+arc_generator.centroid(angle_data[d])[1];
            str=str+"L"+arc_label.centroid(angle_data[d])[0]+","+arc_label.centroid(angle_data[d])[1]
            // console.log(str);
            Pie.append("path")
                .attr("d",str)
                .attr("stroke",color[i])
                .attr("stroke-width",2)
            i++;
            if(i>10)i=0;
        }
    }

    line_label(angle_data(data));

    var text=Pie.selectAll("text")
        .data(angle_data(data))
        .enter()
        .append("text")
        .attr("transform",function (d) {
            return "translate("+arc_label.centroid(d)+")"
        })
        .attr("text-anchor",function (d) {
            var x=arc_label.centroid(d)[0];
            return x<=0?"end":"start";
        })
        .attr("font-size",font_size)
        .style("fill",function (d,i) {
            return color[i];
        })
        .style("text-decoration","underline")
        .text(function (d) {
            return d.data.education+d.data.Percentage;
        })
})education,population 大专以及以上,11964 高中和中专,18799 初中,51966 小学,35876 文盲人口,5466
参考教程:https://www.imooc.com/learn/103