摘要:id=10.1371/journal.pone。0111146本文件分八个步骤处理CCLE数据,一位合格的生物信息学分析师可以完全重写这个过程步骤1:从CancerCellLineEncyclopedia下载27个气体癌细胞系的AffymetrixU133Plus2DNA氨基阵列基因表达[16]2013年3月。第2步:进行了鲁棒多阵列平均化。主成分分析图显示没有明显的副作用。前三步是获得27个胃癌相关细胞系的mRNA表达基质。方法是下载cel文件,用RMA将其标准化,并删除多探针基因探针的最大表达!步骤4:使用CGH数据在细胞系上形成无监督的分层集群。通过Mann-WhitneyU检验,确定了与mRNA基因表达相关的候选基因,和Spearman相关系数测试,Rho˃0.6。第5步:我们对来自CCLEU的27个胃癌细胞系的表达数据进行了一致聚类[17]。我们选择了k=2,给出了一个有效的相似矩阵。第6步:为了将样本分配给这个整合簇,使用了q˂2.0的微阵列[18]的显著性分析,根据CCLE中来自27个胃癌细胞系的1762个基因的RNA表达数据,生成了一个基因型。首先,使用甲基化数据进行聚类以获得推定的驱动因素,然后使用这些基因的表达数据再次聚类,并将其分为两类。然后,使用SAM为这两类寻找不同的基因。第7步:使用ssGSEA来估计胃癌细胞系进入分子特征数据库v3.1[19],[20]的路径活性。路径活性表示为正常化为[0.0,1.0]的基因,或˂0.5以获得来自CCLE中27个胃细胞系的亚型特异性通路。这不仅用于基因集的富集分析,也用于超几何分布的富集分析。结果可以从本文中看到!
转载:http://www.bio-info-trainee.com/1327.html
收集了那么多的癌症细胞系的表达数据,拷贝数变异数据,突变数据,总不能放着让它发霉吧!
这些数据可以利用的地方非常多,但是在谷歌里面搜索引用了它的文章却不多,我挑了其中几个,解读了一下别人是如何利用这个数据的,当然,主要是用那个mRNA的表达数据咯!
这篇文献对CCLE的数据进行了八个步骤的处理,一个合格的生物信息学分析着完全可以重写这个过程
step1:Affymetrix U133 Plus2 DNA microarray gene expressions of 27 gastric cancer cell lines (Kato-III, IM95, SNU-620, SNU-16, OCUM-1, NUGC-4, 2313287, HUG1N, MKN45, NCIN87, KE39, AGS, SNU-5, SNU-216, NUGC-3, NUGC-2, MKN74, MKN7, RERFGC1B, GCIY, KE97, Fu97, SH10TC, MKN1, SNU-1, Hs746 T, HGC27) were downloaded from Cancer Cell Line Encyclopedia (CCLE)
[16] in March 2013.
step2: Robust Multi-array Average (RMA) normalization was performed. Principal component analysis plot show no obvious batch effect.
step3: The normalized data is then collapsed by taking the probe sets with highest gene expression.
前三步是为了得到27个胃癌相关细胞系的mRNA表达矩阵,方法是下载cel文件,用RMA归一化,对多探针基因去最大表达量探针!
step4:Unsupervised hierarchical clustering (1-Spearman distance, average linkage) was performed on the cell lines using the aCGH data.
Putative driver genes of which copy number aberrations correlated to mRNA gene expression were identified to determine subtypes or clusters that are driven by different mechanisms. This was done using Mann Whitney U-test with p<0.05, and Spearman Correlation Coefficient test with Rho >0.6.
step5:We then performed consensus clustering[17] on the gene expression data of the 27 gastric cancer cell lines from CCLE using these putative driver genes. We selected k = 2 as it gives sufficiently stable similarity matrix.
step6: In order to assign new samples to this integrative cluster, significance analysis of microarray (SAM) [18]with threshold q<2.0 was used to generate subtype signature based on the mRNA expression data of the 1762 genes from the 27 gastric cancer cell lines in CCLE.
先用甲基化数据来聚类,得到putative driver genes,然后再用这些基因的表达数据来再次聚类,分成两类,然后对这两类进行SAM找差异基因
step7:ssGSEA (single sample GSEA)was used to estimate pathway activities of the gastric cancer cell line in the Molecular Signature Database v3.1
(Msigdb v3.1) [19],
[20]. The pathway activities are represented in enrichment scores which were rank normalized to [0.0, 1.0].
step8:SAM analysis was performed with threshold q<0.2, and fold change >2.0 (for up-regulated pathways), or <0.5 (for down-regulated pathways) to obtain subtype-specific pathways from the 27 gastric cell lines in CCLE.
这里既用来gene set的富集分析,又用来超几何分布的富集分析,结果去看看这篇文章就知道了!
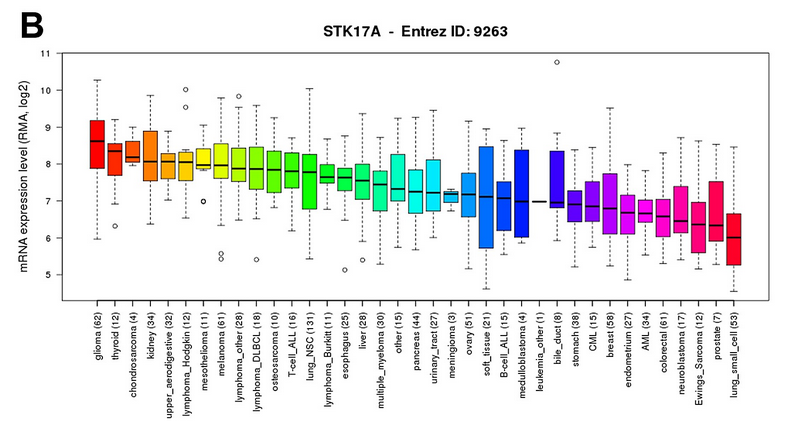
这篇文章只用了CCLE的一个地方,就是看看不同cancer type里面的某个基因表达boxplot
这个图的数据用GEOquery可以得到,样本的分类信息也用GEOquery可以得到,这样就可以做下面这个图了,非常简单
Further, the Cancer Cell Line Encyclopedia (CCLE) database demonstrated that of 1062 cell lines representing 37 distinct cancer types, glioma cell lines express the highest levels of STK17A
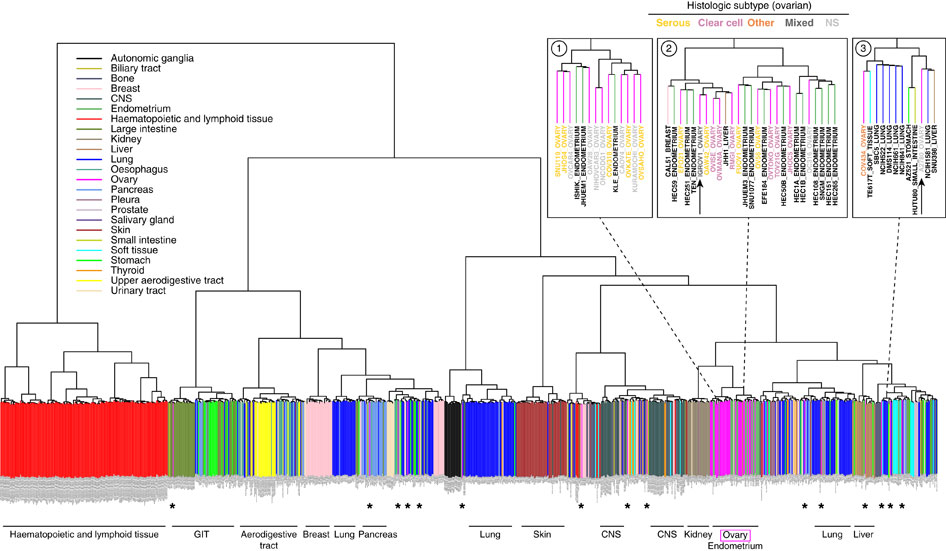
这篇文献更简单了,直接对这个表达矩阵进行聚类:
The 5,000 most variable genes were used for unsupervised clustering of cell lines by mRNA expression data. Cell lines are colour-coded (vertical bars) according to the reported tissue of origin (a PDF version that can be enlarged at high resolution is in
Supplementary Information,
Supplementary Fig. S4); horizontal labels at bottom indicate the dominating tissue types within the respective branches of the dendrogram. Most ovarian cancer cell lines (magenta) cluster together, interspersed with endometrial cell lines. However, some ovarian cancer cell lines cluster with other tissue types (*). Top right panels: neighbourhoods (1) of the top cell lines in our analysis, (2) of cell line IGROV1, and (3) of cell line A2780. For the ovarian cancer cell lines in these enlarged areas, the histological subtype as assigned in the original publication is indicated by coloured letters.
就直接拿整个表达矩阵即可,然后挑选变异最大的5000个基因来进行聚类,就可以得到类似的图