一 相信有很多博客都已经详细的说明了prometheus的作用以及相关的作用以及原理,这里不在赘述,仅仅从部署和配置2个方面来记录一下,为公司产品组搭建的prometheus告警平台的过程以及踩过的坑,废话不多说,直接开始搭建部署,需要在一台服务器上面搭建prometheus+grafana+alertmanager+pushgateway,其余被监控的节点部署node_exporter,也可以在prometheus服务端部署node_exporter
1.1 部署prometheus,并且使用systemctl进行管控
安装版本:prometheus-2.6.1
百度云下载:https://pan.baidu.com/s/1w16lQZKw8PCHqlRuSK2i7A
提取码:lw1q
之后将包解压到: /usr/local/prometheus目录下面,建议使用ansible脚本进行部署
这里附上安装管理的管理文件以及目录地址/usr/lib/systemd/system/prometheus.service
[Unit]
  Description=https://prometheus.io

  [Service]
  Restart=on-failure
  ExecStart=/usr/local/prometheus/prometheus --config.file=/usr/local/prometheus/prometheus.yml

  [Install]
  WantedBy=multi-user.target
1.2 整理后的prometheus配置文件,添加新的监控节点job_name和机器的节点,并且节点需要安装相应的node_exporter
# my global config
global:
  scrape_interval:     15s # Set the scrape interval to every 15 seconds. Default is every 1 minute.
  evaluation_interval: 15s # Evaluate rules every 15 seconds. The default is every 1 minute.
  # scrape_timeout is set to the global default (10s).

# Alertmanager configuration
alerting:
  alertmanagers:
  - static_configs:
    - targets:
      - 172.16.5.3:9093

# Load rules once and periodically evaluate them according to the global 'evaluation_interval'.
rule_files:
   - "rules/first_rules.yml"
   - "rules/second_rules.yml"

# A scrape configuration containing exactly one endpoint to scrape:
# Here it's Prometheus itself.
scrape_configs:
  # The job name is added as a label `job=<job_name>` to any timeseries scraped from this config.
  - job_name: 'prometheus'
    static_configs:
    - targets: ['localhost:9090','172.16.5.3:9100']- job_name: 'pushgateway'
    scrape_interval: 5s
    static_configs:
    - targets: ['172.16.5.3:9091']
      labels:
        instance: pushgateway
1.3 对服务器的基础监控项如如下所示
#cat second_rules.yml
groups:
- name: 实例存活告警规则
  rules:
  - alert: 实例存活告警
    expr: up{job="prometheus"} == 0 or up{job="Linux-host"} == 0
    for: 1m
    labels:
      user: prometheus
      severity: emergency
      team: HTY
    annotations:
      summary: "Instance {{ $labels.instance }} is down"
      description: "Instance {{ $labels.instance }} of job {{ $labels.job }} has been down for more than 1 minutes."
      value: "{{ $value }}"

- name: 内存告警规则
  rules:
  - alert: "内存使用率告警"
    expr: (node_memory_MemTotal_bytes - (node_memory_MemFree_bytes+node_memory_Buffers_bytes+node_memory_Cached_bytes )) / node_memory_MemTotal_bytes * 100 > 30
    for: 1m
    labels:
      team: C3
      user: prometheus
      severity: warning
    annotations:
      summary: "服务器: {{$labels.alertname}} 内存报警"
      description: "{{ $labels.alertname }} 内存资源利用率大于30%!(当前值: {{ $value }}%)"
      value: "{{ $value }}"

- name: 内存告警规则2
  rules:
  - alert: "内存使用率告警2"
    expr: (node_memory_MemTotal_bytes - (node_memory_MemFree_bytes+node_memory_Buffers_bytes+node_memory_Cached_bytes )) / node_memory_MemTotal_bytes * 100 > 50
    for: 1m
    labels:
      team: C3
      user: prometheus
      severity: critical
    annotations:
      summary: "服务器: {{$labels.alertname}} 内存报警"
      description: "{{ $labels.alertname }} 内存资源利用率大于50%!(当前值: {{ $value }}%)"
      value: "{{ $value }}"

- name: CPU报警规则
  rules:
  - alert: CPU使用率告警
    expr: 100 - (avg by (instance)(irate(node_cpu_seconds_total{mode="idle"}[1m]) )) * 100 > 70
    for: 1m
    labels:
      user: prometheus
      severity: warning
    annotations:
      summary: "服务器: {{$labels.alertname}} CPU报警"
      description: "服务器: CPU使用超过70%!(当前值: {{ $value }}%)"
      value: "{{ $value }}"

- name: 磁盘报警规则
  rules:
  - alert: 磁盘使用率告警
    expr: (node_filesystem_size_bytes - node_filesystem_avail_bytes) / node_filesystem_size_bytes * 100 > 80
    for: 1m
    labels:
      user: prometheus
      severity: warning
    annotations:
      summary: "服务器: {{$labels.alertname}} 磁盘报警"
      description: "服务器:{{$labels.alertname}},磁盘设备: 使用超过80%!(挂载点: {{ $labels.mountpoint }} 当前值: {{ $value }}%)"
      value: "{{ $value }}"
2 安装以及配置alertmanager
global:
  # 企业微信告警配置
  resolve_timeout: 5m
  wechat_api_url: 'https://qyapi.weixin.qq.com/cgi-bin/'
  wechat_api_corp_id: 'ww41a2b13ef47aac58'
  wechat_api_secret: 'xxxxx'
  # qq邮箱告警配置
  smtp_from: xxx@qq.com
  smtp_auth_username: xx@qq.com
  smtp_auth_password: xxxx #需要从qq邮箱上面获取
  smtp_require_tls: false
  smtp_smarthost: 'smtp.qq.com:465'
templates:
  - "/usr/local/alertmanager/template/*.tmpl"
route:
  receiver: 'default-receiver'
  group_wait: 10s
  group_interval: 30s
  repeat_interval: 1m
  group_by: ['team']
  routes:
  - group_by: ['test']
    group_wait: 10s
    group_interval: 30s
    repeat_interval: 1m
    receiver: 'wechat'
    match:
      team: test1
receivers:
- name: 'wechat'
  wechat_configs:
  - send_resolved: true
    message: '{{ template "wechat.default.message" .}}'
    to_party: 'xxxx'
    agent_id: "xxx"需要从企业微信上面获取
    api_secret: 'xxxxxxxx'
- name: 'default-receiver'
  email_configs:
  - to: 'xxxxxx@qq.com'
    send_resolved: true
    # html: '{{ template "wechat.default.message" .}}'
inhibit_rules:
  - source_match:
      severity: 'critical'
    target_match:
      severity: 'warning'
    equal: ['env','team','instance','type','group','job','alertname']
获取企业微信的方式参考这个链接:https://www.cnblogs.com/miaocbin/p/13706164.html
获取qq邮箱参考这个链接:https://blog.csdn.net/knight_zhou/article/details/105137581
3 附上模版信息
{{ define "wechat.default.message" }}
{{- if gt (len .Alerts.Firing) 0 -}}
{{- range $index, $alert := .Alerts -}}
{{- if eq $index 0 }}
========= 监控报警 =========
告警状态:{{   .Status }}
告警级别:{{ .Labels.severity }}
告警类型:{{ $alert.Labels.alertname }}
故障主机: {{ $alert.Labels.instance }}
告警主题: {{ $alert.Annotations.summary }}
告警详情: {{ $alert.Annotations.message }}{{ $alert.Annotations.description}};
触发阀值:{{ .Annotations.value }}
故障时间: {{ ($alert.StartsAt.Add 28800e9).Format "2006-01-02 15:04:05" }}
========= = end =  =========
{{- end }}
{{- end }}
{{- end }}
{{- if gt (len .Alerts.Resolved) 0 -}}
{{- range $index, $alert := .Alerts -}}
{{- if eq $index 0 }}
========= 异常恢复 =========
告警类型:{{ .Labels.alertname }}
告警状态:{{   .Status }}
告警主题: {{ $alert.Annotations.summary }}
告警详情: {{ $alert.Annotations.message }}{{ $alert.Annotations.description}};
故障时间: {{ ($alert.StartsAt.Add 28800e9).Format "2006-01-02 15:04:05" }}
恢复时间: {{ ($alert.EndsAt.Add 28800e9).Format "2006-01-02 15:04:05" }}
{{- if gt (len $alert.Labels.instance) 0 }}
实例信息: {{ $alert.Labels.instance }}
{{- end }}
========= = end =  =========
{{- end }}
{{- end }}
{{- end }}
{{- end }}
4. 安装以及部署grafana,推荐安装最新版的prometheus,然后使用插件,附上一个比较简洁的grafana看板
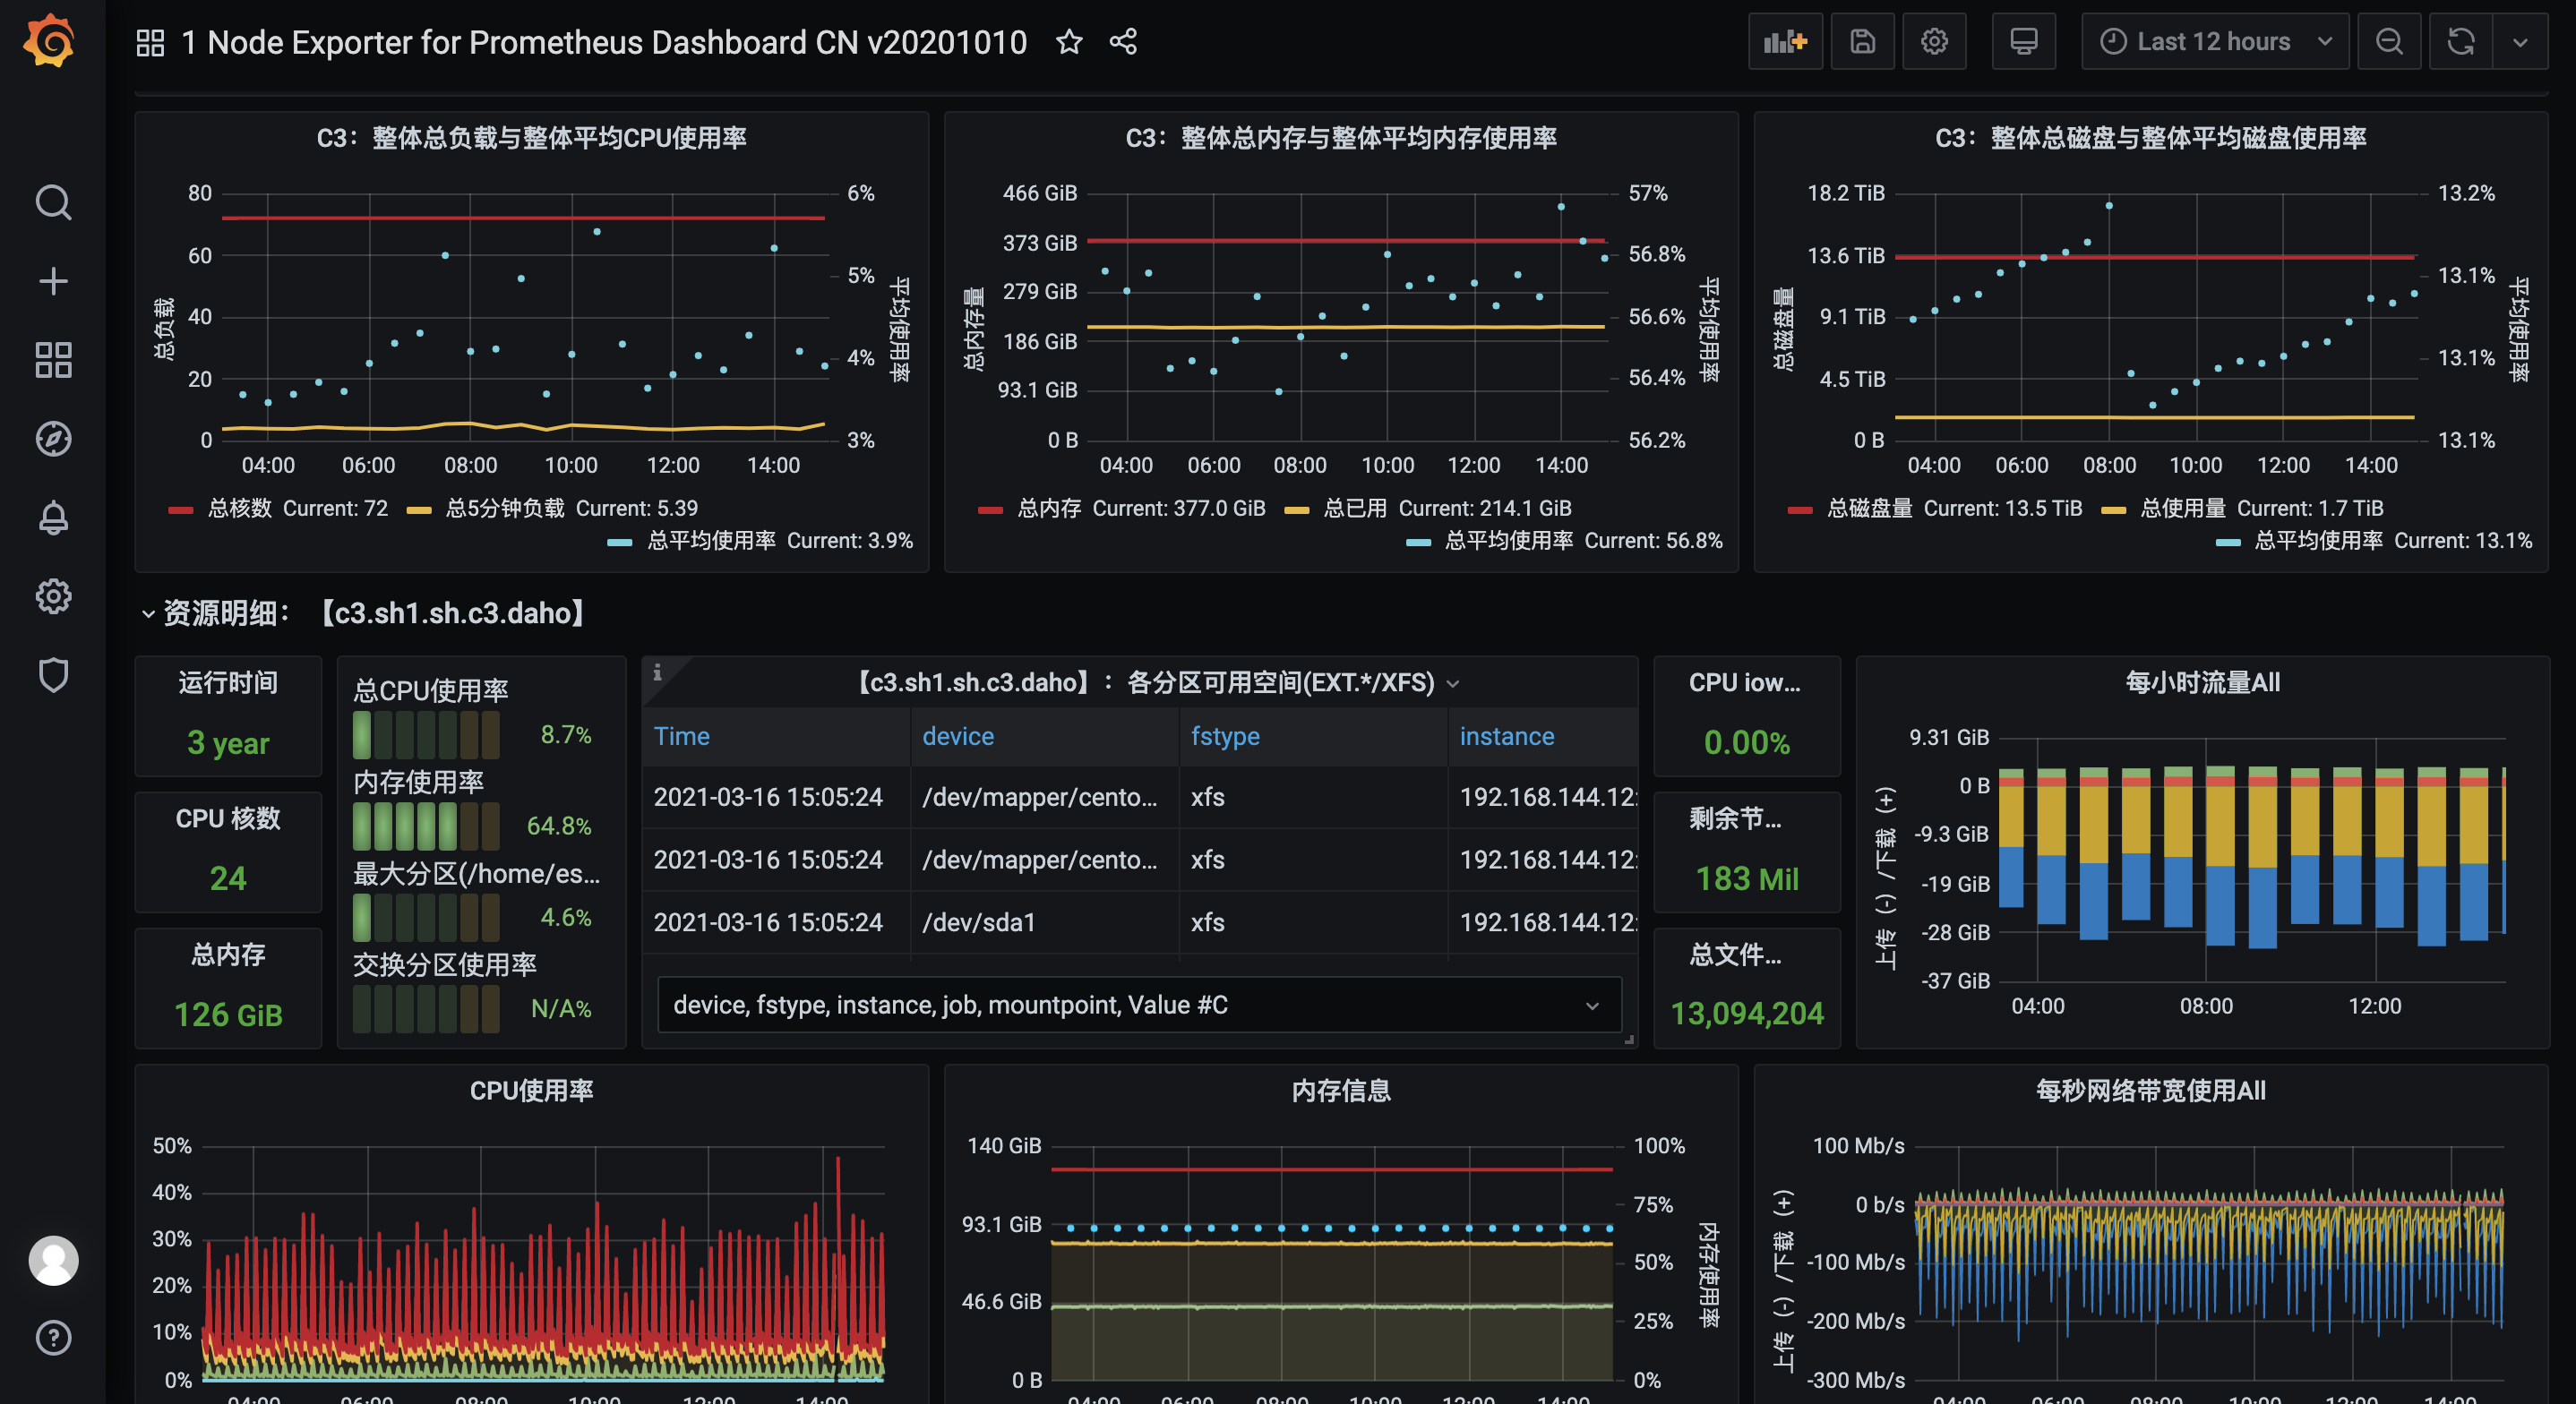
直接倒入模板,倒入步骤参考这便博客:https://www.cnblogs.com/wukc/p/14231042.html