观察网络流量的工具-iptraf-ng

摘要:
最近看到vmlinux大神介绍了一款网络查看工具,感觉很好用,下面进行简要摘录:iptraf-ng可以方便查看当前服务器网络状况:CentOS7.0,采用了衍生版本iptraf-ng。p=11观察网络性能时如何选择工具

最近看到vmlinux大神介绍了一款网络查看工具,感觉很好用,下面进行简要摘录:

iptraf-ng 可以方便查看当前服务器网络状况:CentOS 7.0,采用了衍生版本iptraf-ng 。

iptraf-ng -h
usage: iptraf-ng [options]
   or: iptraf-ng [options] -B [-i <iface> | -d <iface> | -s <iface> | -z <iface> | -l <iface> | -g]

    -h, --help            show this help message

    -i <iface>            start the IP traffic monitor (use '-i all' forall interfaces)
    -d <iface>start the detailed statistics facility on an interface
    -s <iface>start the TCP and UDP monitor on an interface
    -z <iface>shows the packet size counts on an interface
    -l <iface>            start the LAN station monitor (use '-l all' forall LAN interfaces)
    -g                    start the general interface statistics

    -B                    run inbackground (use only with one of the above parameters
    -f                    clearall locks and counters
    -t <n>                run only for the specified <n>number of minutes
    -L <logfile>          specifies an alternate log file

简要步骤:

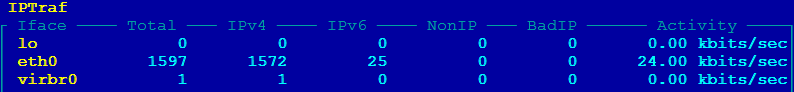
“iptraf -g” 显示每一个网卡上的流量:

观察网络流量的工具-iptraf-ng第1张

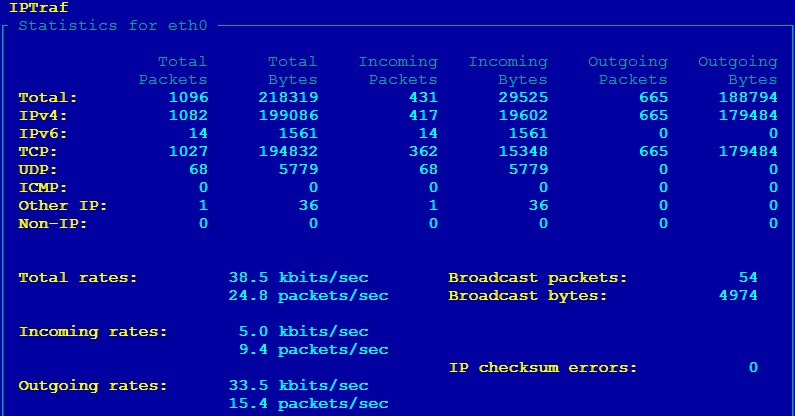
“iptraf -d eth0” 显示指定网卡上的流量统计,总体流量、流入量、流出量、以及按协议分类的流量统计:

观察网络流量的工具-iptraf-ng第2张

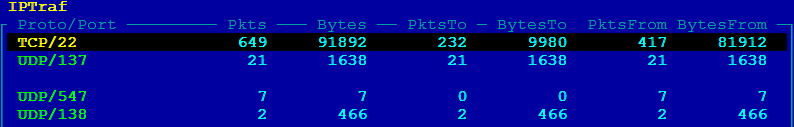
“iptraf -s eth0” 统计各port的流量:

观察网络流量的工具-iptraf-ng第3张

“iptraf -i eth0” 查看远程主机端口:

观察网络流量的工具-iptraf-ng第4张

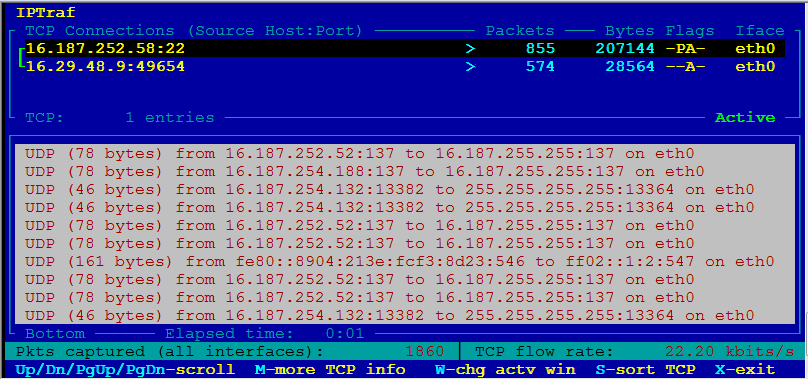
“iptraf -i eth0” 的输出分为两个窗口,上面是TCP socket pairs,下面是UDP。我们根据端口号 使用 lsof 可以找到对应的进程号;

参考文件:

http://linuxperf.com/?p=11

观察网络性能时如何选择工具

免责声明:文章转载自《观察网络流量的工具-iptraf-ng》仅用于学习参考。如对内容有疑问,请及时联系本站处理。

上篇Laravel5.1 响应--ResponseiOS12中推送通知新特性下篇

宿迁高防,2C2G15M,22元/月;香港BGP,2C5G5M,25元/月 雨云优惠码:MjYwNzM=

相关文章

使用GAN进行异常检测——可以进行网络流量的自学习哇,哥哥,人家是半监督,无监督的话,还是要VAE,SAE。

实验了效果,下面的还是图像的异常检测居多。 https://github.com/LeeDoYup/AnoGAN https://github.com/tkwoo/anogan-keras 看了下,本质上是半监督学习,一开始是有分类模型的。代码如下,生产模型和判别模型: ### generator model define def generator_m...

CentOS7 监控网络流量

首先,以下介绍的流量监控工具安装之前均需要安装epel源, 安装epel源: [root@bogon ~]# yum -y install epel-release 安装 iftop 工具,查看各个连接的流量情况 [root@bogon ~]# yum -y install iftop [root@bogon ~]# iftop -i ens33 -n -...

windows获取系统网络流量

函数   DWORD GetIfTable(          PMIB_IFTABLE pIfTable,          PULONG pdwSize,          BOOL bOrder   ); 功能   获取MIB-II接口列表 参数   PMIB_IFTABLE pIfTable:接收缓冲区,接收GetIfTable返回的MIB-I...

CentOS查看CPU、内存、网络流量和磁盘 I/O【详细】

安装 yum install -y sysstat sar -d 1 1 rrqm/s: 每秒进行 merge 的读操作数目。即 delta(rmerge)/swrqm/s: 每秒进行 merge 的写操作数目。即 delta(wmerge)/sr/s: 每秒完成的读 I/O 设备次数。即 delta(rio)/sw/s: 每秒完成的写 I/O 设备次数。...

windows网络流量监控

NPCap 官网 https://nmap.org/npcap/ 这是抓包必须先安装的工具,具体的原因可以看 https://github.com/buger/goreplay/wiki/Running-on-Windows due to the nature of different networking layer of Windows stack....

OpenStack Neutron 之 Load Balance

OpenStack Neutron 之 Load Balance 负载均衡(Load Balance)是 OpenStack Neutron 支持的功能之一。负载均衡能够将网络请求分发到多个实际处理请求的虚机上,这样能有效处理高流量的网络请求,负载均衡在现实中有很多使用场景。本文将基于 Neutron 所提供的负载均衡,介绍其基本概念、实现过程,并验证...