#ELK 6安装配置 nginx日志收集 kabana汉化
环境 centos 7.4 ,ELK 6 ,单节点
服务端
Logstash 收集,过滤
Elasticsearch 存储,索引日志
Kibana 可视化
客户端
filebeat 监控、转发,作为agentfilebeat-->Logstash-->Elasticsearch-->Kibana
#基本配置
- 时间同步
- 关闭selinux
- 内核优化
- 防火墙端口
#内核
echo '
* hard nofile 65536
* soft nofile 65536
* soft nproc  65536
* hard nproc  65536
'>>/etc/security/limit.conf
echo '
vm.max_map_count = 262144
net.core.somaxconn=65535
net.ipv4.ip_forward = 1
'>>/etc/sysctl.conf
sysctl -p
#防火墙
firewall-cmd --permanent --add-port={9200/tcp,9300/tcp,5044/tcp,5601/tcp}
firewall-cmd --reload
frewall-cmd  --list-all
#安装
可以下载tar或者rpm包安装
官网 https://www.elastic.co/downloads
中文 https://www.elastic.co/cn/products
下载rpm包
https://artifacts.elastic.co/downloads/elasticsearch/elasticsearch-6.2.2.rpm
https://artifacts.elastic.co/downloads/logstash/logstash-6.2.2.rpm
https://artifacts.elastic.co/downloads/kibana/kibana-6.2.2-x86_64.rpm
https://artifacts.elastic.co/downloads/beats/filebeat/filebeat-6.2.2-x86_64.rpm
#安装JDK, elasticsearch需要java环境
yum install java-1.8.0-openjdk -y
#配置yum源
rpm --import https://artifacts.elastic.co/GPG-KEY-elasticsearch
echo '
[elk-6]
name=elk-6
baseurl=https://artifacts.elastic.co/packages/6.x/yum
gpgcheck=1
gpgkey=https://artifacts.elastic.co/GPG-KEY-elasticsearch
enabled=1
'>/etc/yum.repos.d/elk.repo
#安装
yum install elasticsearch -y
yum install logstash -y
yum install kibana -y
yum install filebeat -y
#elasticsearch配置
 #查看配置
rpm -qc elasticsearch
grep -v '^#' /etc/elasticsearch/elasticsearch.yml
cp /etc/elasticsearch/elasticsearch.yml{,.bak}

 #更改配置
echo '
path.data: /var/lib/elasticsearch
path.logs: /var/log/elasticsearch
cluster.name: ELK
node.name: elk.novalocal
network.host: 0.0.0.0
http.port: 9200
discovery.zen.ping.unicast.hosts: ["172.16.50.32:9300"]
discovery.zen.minimum_master_nodes: 1
'>/etc/elasticsearch/elasticsearch.yml
 #修改配置后
systemctl daemon-reload

 #启动
systemctl enable  elasticsearch
systemctl restart elasticsearch

 #check
systemctl status elasticsearch
netstat -nltp | grep java
curl -X GET http://localhost:9200
#logstash配置
- input :数据输入
- filter:数据转化,过滤,分析
- output:数据输出
 #查看配置
rpm -qc logstash
egrep -v '^#|^$' /etc/logstash/logstash.yml
cp /etc/logstash/logstash.yml{,.bak}

echo 'path.config: /etc/logstash/conf.d'>>/etc/logstash/logstash.yml

 #添加一个日志处理文件
 #filebeat->logstash->elasticsearch
echo '
input {

 #收集本地log#
  file {
     type => "logtest"
     path => "/var/log/logtest.txt"
     start_position => "beginning"
  }

 #filebeat客户端#
  beats {
     port => 5044
  }

}

 #筛选
 #filter { }

output {

#标准输出,调试使用#
  stdout {
   codec => rubydebug { }
  }

# 输出到es#
  elasticsearch {
    hosts => ["http://172.16.50.32:9200"]
    index => "%{type}-%{+YYYY.MM.dd}"
  }

}
'>/etc/logstash/conf.d/logstash-01.conf
#调试(可选)
 #检测配置
/usr/share/logstash/bin/logstash -f /etc/logstash/conf.d/logstash-01.conf --config.test_and_exit
 #生成测试log
echo $(date +"%F-%T") log-test >>/var/log/logtest.txt
 #启动,查看生成日志
/usr/share/logstash/bin/logstash -f /etc/logstash/conf.d/logstash-01.conf
#启动
systemctl enable logstash
systemctl restart  logstash
#check
sleep 20
systemctl status logstash
netstat -nltp | grep java
#kibana配置
 #配置
rpm -qc kibana
cp /etc/kibana/kibana.yml{,.bak}
grep -v '^#' /etc/kibana/kibana.yml.bak
echo '
server.port: 5601
server.host: "0.0.0.0"
 # ES的url的一个ES节点#
 #elasticsearch.url: "http://172.16.50.32:9200"
elasticsearch.url: "http://localhost:9200"
kibana.index: ".kibana"
 #kibana.defaultAppId: "home"
'>/etc/kibana/kibana.yml

#### #启动
systemctl enable  kibana
systemctl restart kibana

#### #check
systemctl status kibana
netstat -nltp | grep node

 #防火墙对外开放tcp/5601
 #浏览器访问 ip:5601
#汉化kibana (可选)
[[ -f /usr/bin/git ]] || { echo 'install git';yum install -y git &>/dev/null; }
git clone https://github.com/anbai-inc/Kibana_Hanization.git
cd Kibana_Hanization
python main.py /usr/share/kibana

 #重启kibana
systemctl restart kibana
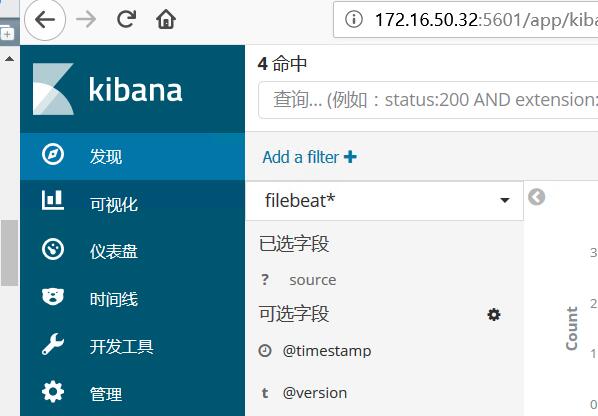
#浏览器访问kabana设置
首次打开,需要添加索引模式
Management管理-->Index Patterns索引模式-->Create index pattern创建索引模式
填写*(索引名)-->Next step-->选择如@timestamp-->Create index pattern ,完成
Index pattern 下面填写logstash配置的名称如type => "logs"填写logs
#filebeat配置 (轻量客户端)
yum install -y filebeat
#查看配置
rpm -qc filebeat
egrep -v '#|^$' /etc/filebeat/filebeat.yml
cp /etc/filebeat/filebeat.yml{,.bak}
#收集nginx日志试列
 #安装nginx
rpm -Uvh http://nginx.org/packages/centos/7/noarch/RPMS/nginx-release-centos-7-0.el7.ngx.noarch.rpm
yum install -y nginx
systemctl start nginx
curl localhost
 #查看nginx日志
tail /var/log/nginx/access.log
#配置filebeat收集nginx日志
echo '#filebeat#
filebeat.prospectors:
#nginx
- input_type: log
  enable: yes
  #tags: nginx-access
  paths:
    - /var/log/nginx/access.log
  exclude_lines: ["^$"]
  fields:
    type: "nginx-access"
  fields_under_root: true

output.logstash:
  hosts: ["localhost:5044"]
  #hosts: ["172.16.50.32:5044"]
  #index: filebeat
'>/etc/filebeat/filebeat.yml
#启动
 systemctl enable  filebeat
 systemctl restart filebeat
 systemctl status  filebeat
#在kibana查看日志
#logstash使用grok过滤nginx日志
nginx日志有main和log_json两种,默认为main普通文本格式
ELK存储为json格式,文本格式华,拆分出如ip地址、访问agent等,便于后续使用
#nginx默认日志格式
    log_format  main  '$remote_addr - $remote_user [$time_local] "$request" '
                      '$status $body_bytes_sent "$http_referer" '
                      '"$http_user_agent" "$http_x_forwarded_for"';

 #curl localhost生成日志格式如下
 #127.0.0.1 - - [22/Mar/2018:18:37:37 +0800] "GET / HTTP/1.1" 200 612 "-" "curl/7.29.0" "-"
#logstash配置,使用grok过滤nginx日志
grok使用的正则表达式在grok-patterns文件
可以引用或添加自定义规则
Grok=$(find / -name grok-patterns)
echo $Grok
/usr/share/logstash/vendor/bundle/jruby/2.3.0/gems/logstash-patterns-core-4.1.2/patterns/grok-patterns
 #创建nginx正则表达式(引用grok正则)
echo '#nginx-access
WZ ([^ ]*)
NGINXACCESS %{IP:remote_ip} - - [%{HTTPDATE:timestamp}] "%{WORD:method} %{WZ:request} HTTP/%{NUMBER:httpversion}" %{NUMBER:status} %{NUMBER:bytes} %{QS:referer} %{QS:agent} %{QS:xforward}
'>/etc/logstash/conf.d/nginx-access


 #重新生成logstash配置文件
echo '
input {

 #收集本地log#
  file {
     type => "logtest"
     path => "/var/log/logtest.txt"
     start_position => "beginning"
  }

 #filebeat客户端#
  beats {
     port => 5044
  }

}

 # #筛选
filter {

# 如果是nginx访问日志
  if ( [type] == "nginx-access" ) {

    #按字段切割
    grok {
      patterns_dir=>"/etc/logstash/conf.d/nginx-access"
      match => { "message" => "%{NGINXACCESS}" }
      }

    # 时间格式转换
    date {
      match => [ "timestamp", "dd/MMM/YYYY:HH:mm:ss Z" ]
      }

    # 删除不需要的字段
    mutate {
      remove_field => [ "offset", "@version", "beat", "input_type", "tags","id"]
      }
    }
}

output {

#标准输出,调试使用#
  stdout {
   codec => rubydebug { }
  }

# 输出到es#
  elasticsearch {
    hosts => ["http://172.16.50.32:9200"]
    index => "%{type}-%{+YYYY.MM.dd}"
  }

}
'>/etc/logstash/conf.d/logstash-01.conf
#检测配置
/usr/share/logstash/bin/logstash -t -f /etc/logstash/conf.d/logstash-01.conf
#调试logstash
 #关闭
systemctl stop  logstash
 #在终端启动查看
/usr/share/logstash/bin/logstash -f /etc/logstash/conf.d/logstash-01.conf
#访问nginx产生日志,在elasticsearch-head或者kabana查看nginx日志
logstash配置文件可拆分为多个,按input、filter、output类型+序列号指定优先级
#elasticsearch调试工具(可选)
#elasticsearch安装head插件
#安装NodeJS (epel源)
yum install -y nodejs
#安装npm
npm install -g cnpm --registry=https://registry.npm.taobao.org
#使用npm安装grunt
npm install -g grunt
#安装elasticsearch-head
#查看https://github.com/mobz/elasticsearch-head
mkdir /opt/head
cd /opt/head
git clone git://github.com/mobz/elasticsearch-head.git
cd elasticsearch-head
npm install
#启动
npm run start &
#配置elasticsearch访问
echo '#elasticsearch-head
http.cors.enabled: true
http.cors.allow-origin: "*"
'>>/etc/elasticsearch/elasticsearch.yml
#重启elasticsearch
systemctl restart elasticsearch
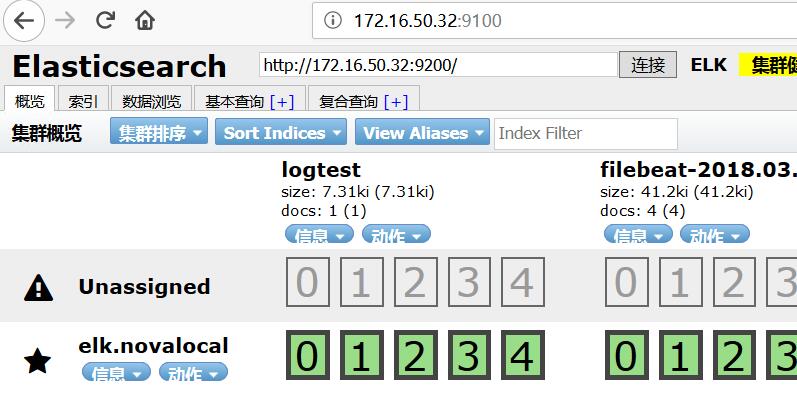
#浏览器访问9100端口
http://ip:9100/
#出现“未连接”,请修改localhost为ip地址
##################