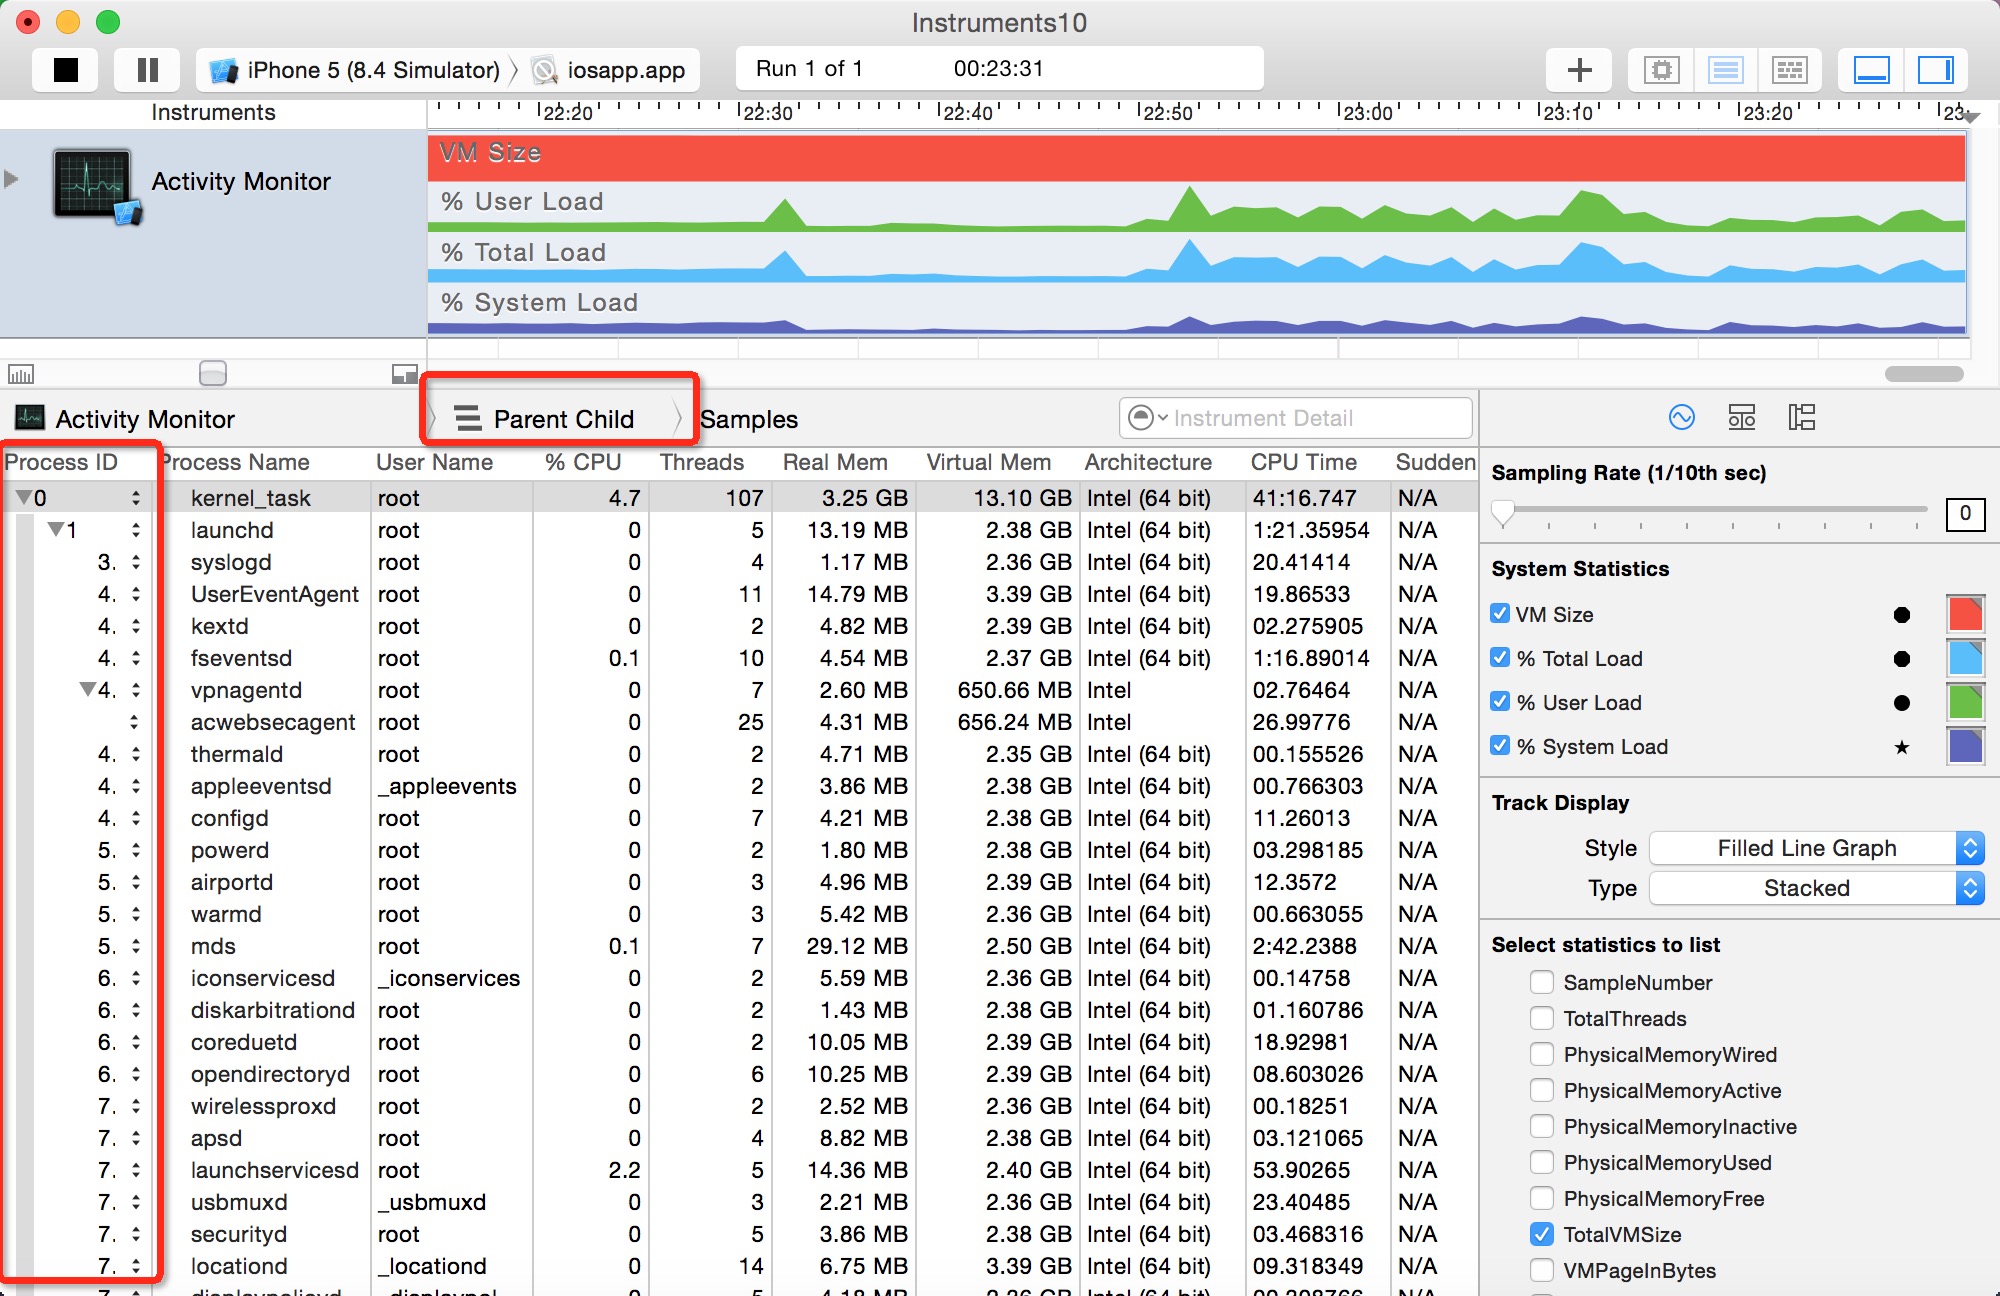
parent child information)-----父进程和子进程的关系,以及各个进程的概要信息

- Physical Memory Wired——操作系统占用的内存
- Physical Memory Active——除操作系统外其它进程占用的内存
- Physical Memory Inactive——最近被释放的内存
- Physical Memory Used——profiling当前进程时使用的总内存
- Physical Memory Free——当前的可用内存
- Total VM Size——虚拟内存的占用量
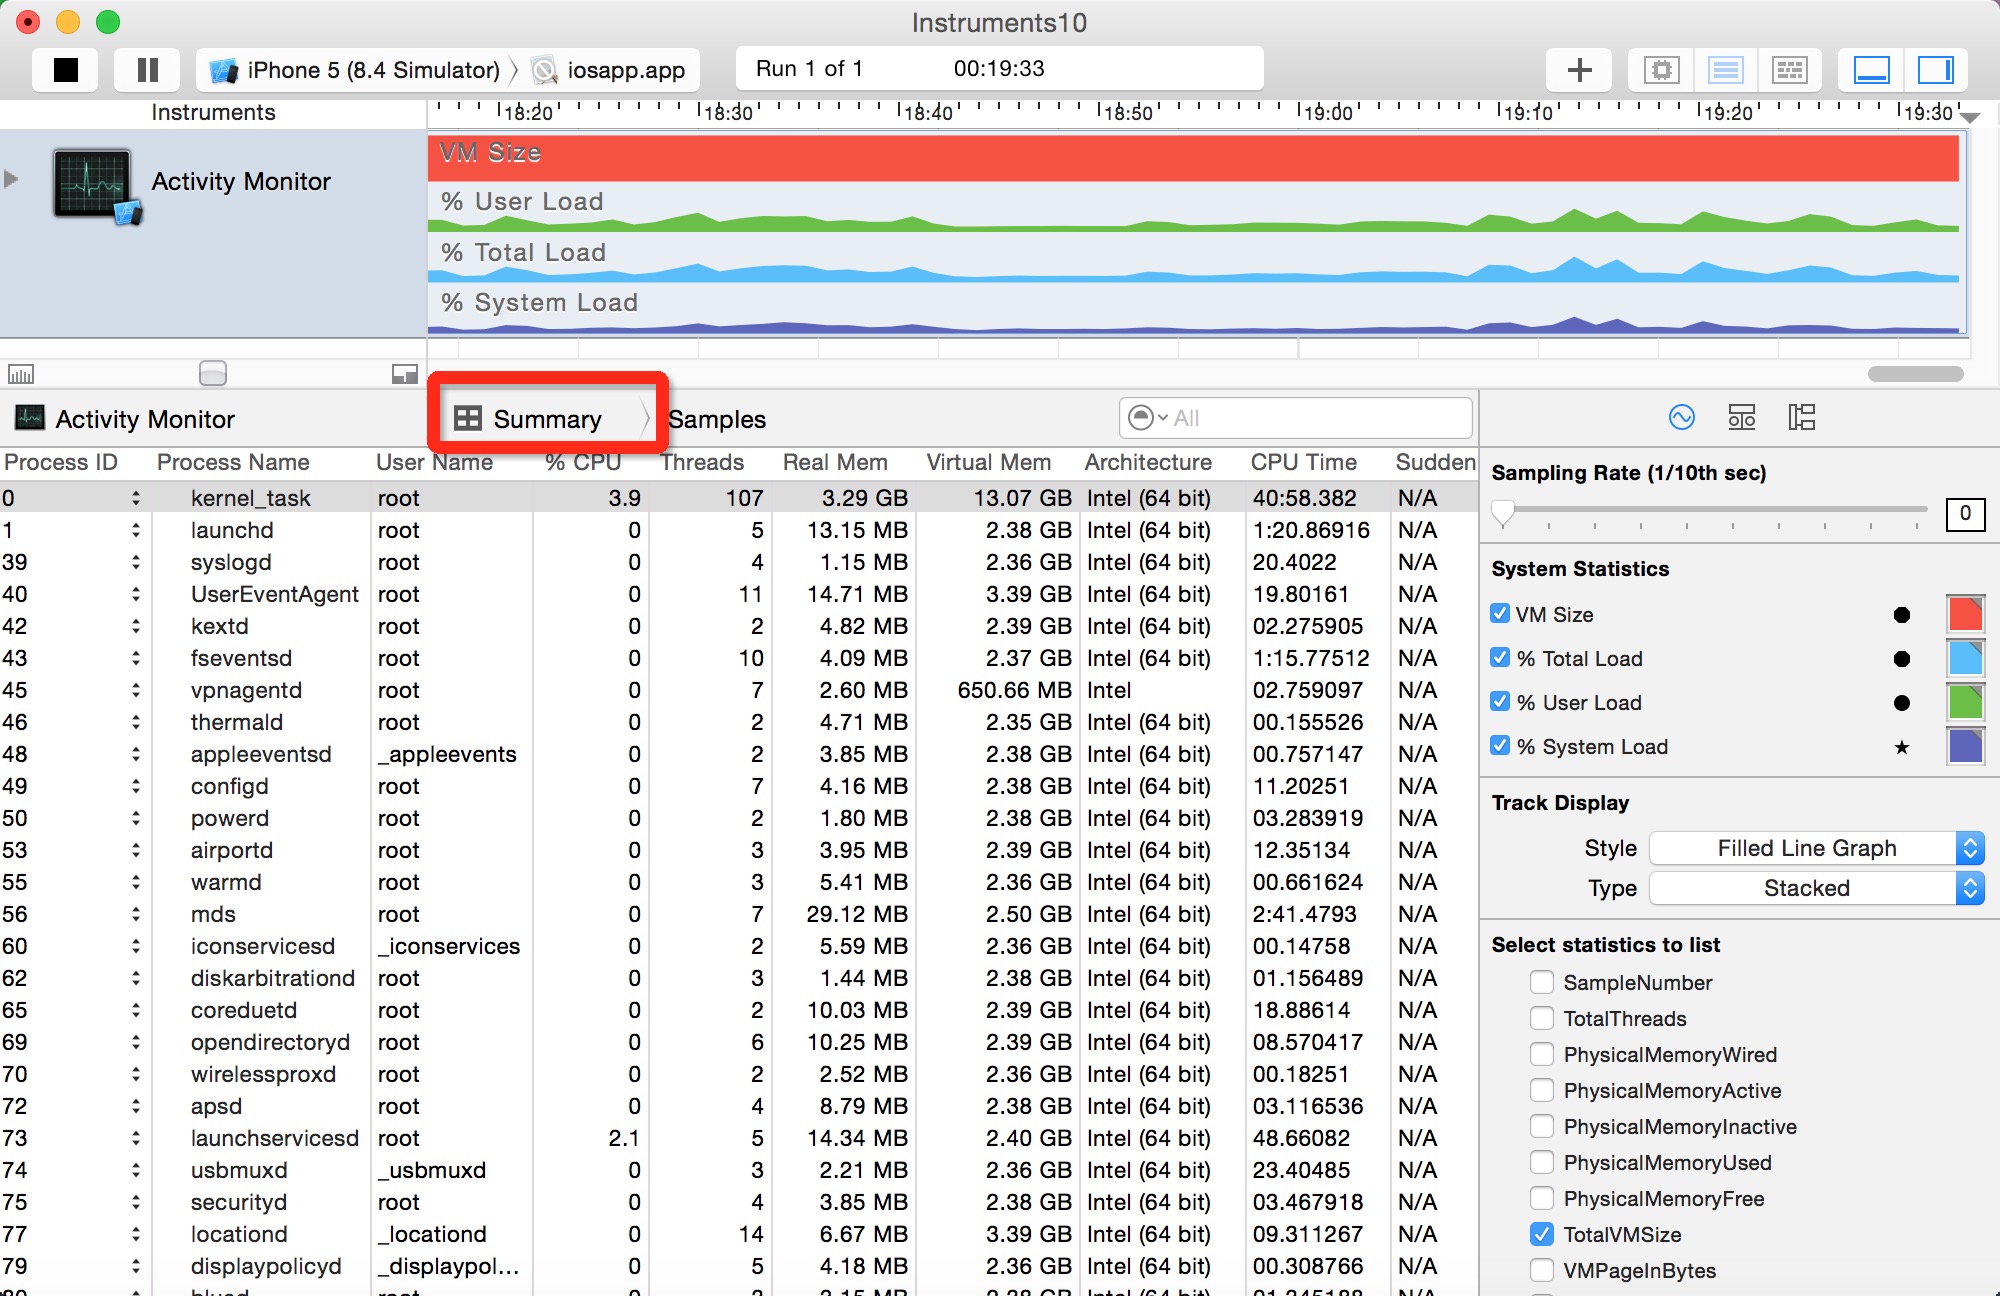
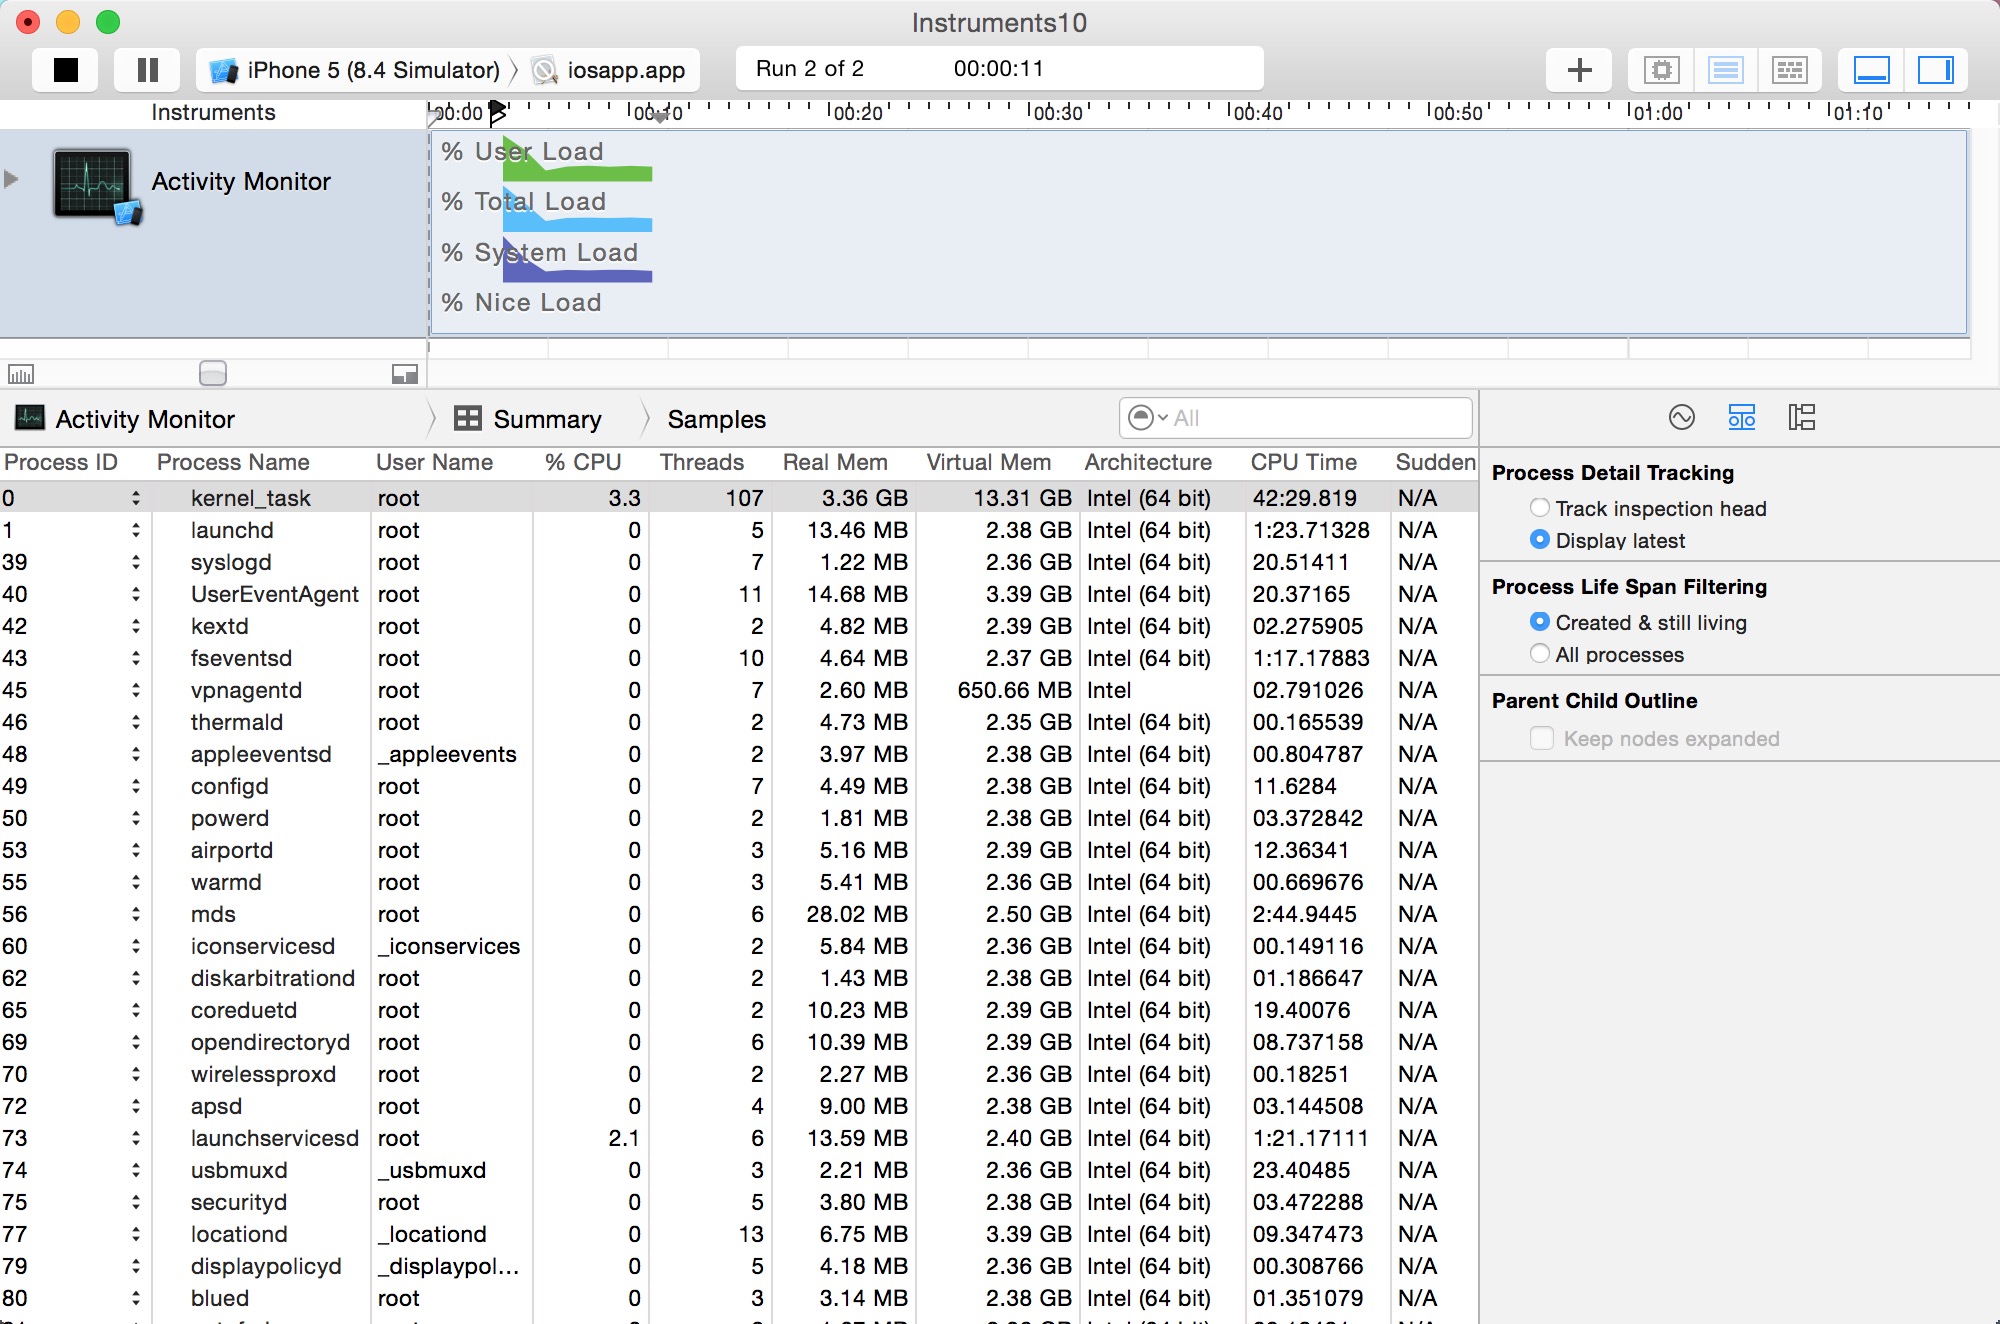
TotalVMSize、CPUTotalLoad、CPUUserLoad、CPUSystemLoad,在使用时可以根据自己的需要选择相关的分析内容进行显示,并且不同的内存使用部分可以使用不同的颜色加以区分,下面就是Activity Monitor在使用过程中的界面截图,在右下角可选择内存相关的分析内容。
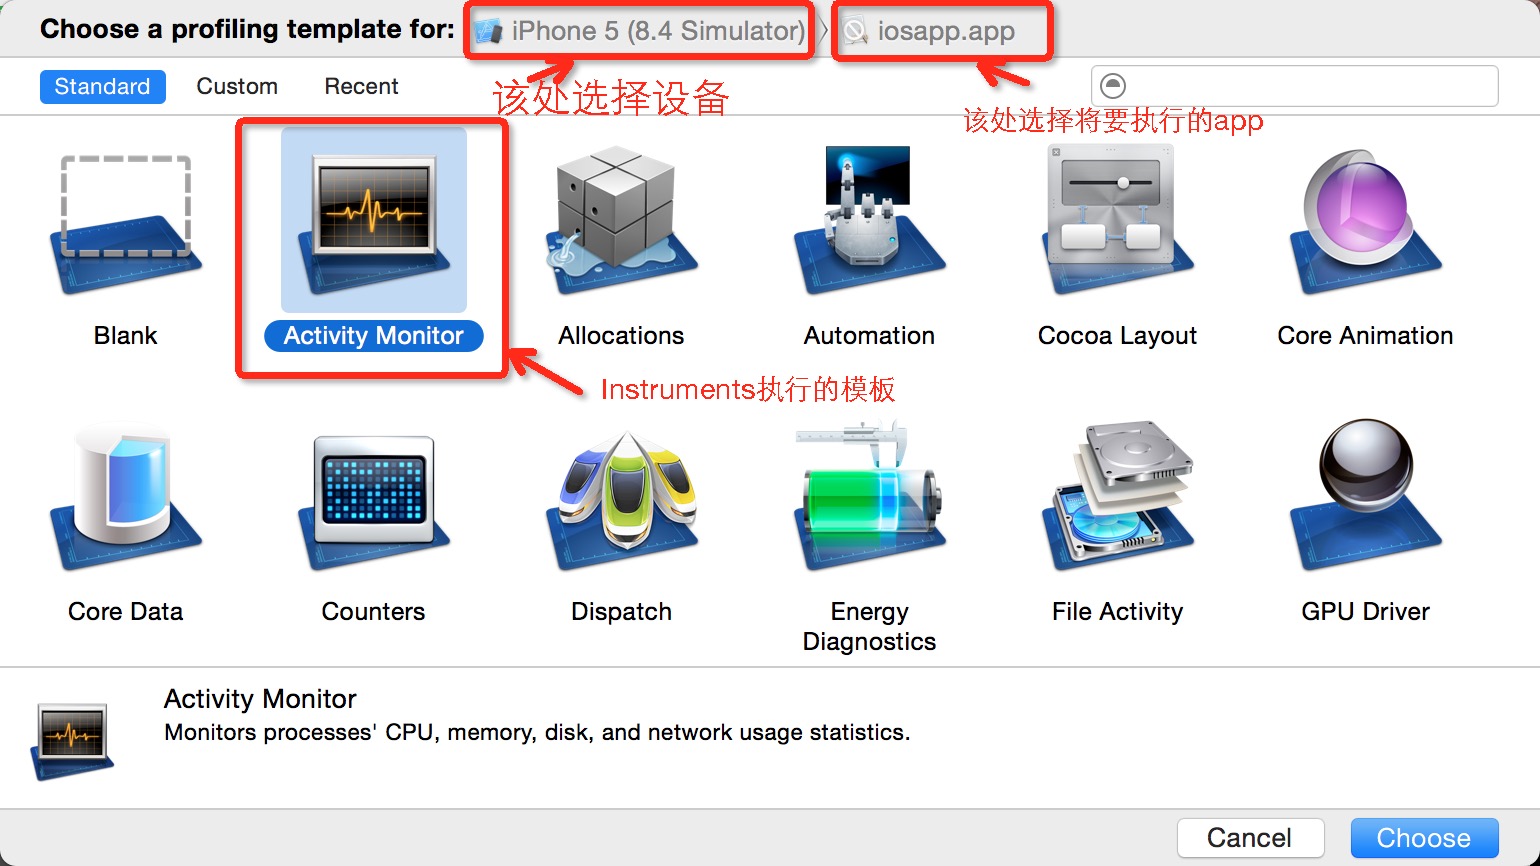
Examining Memory Usage with the Activity Monitor Trace Template
The Activity Monitor trace template monitors overall system activity and statistics, including CPU, memory, disk, and network. It consists of the Activity Monitor instrument only, although you can add additional instruments to a trace document you’ve created with the template, if you desire. You’ll see later that the Activity Monitor is also used to monitor network activity on iOS devices.
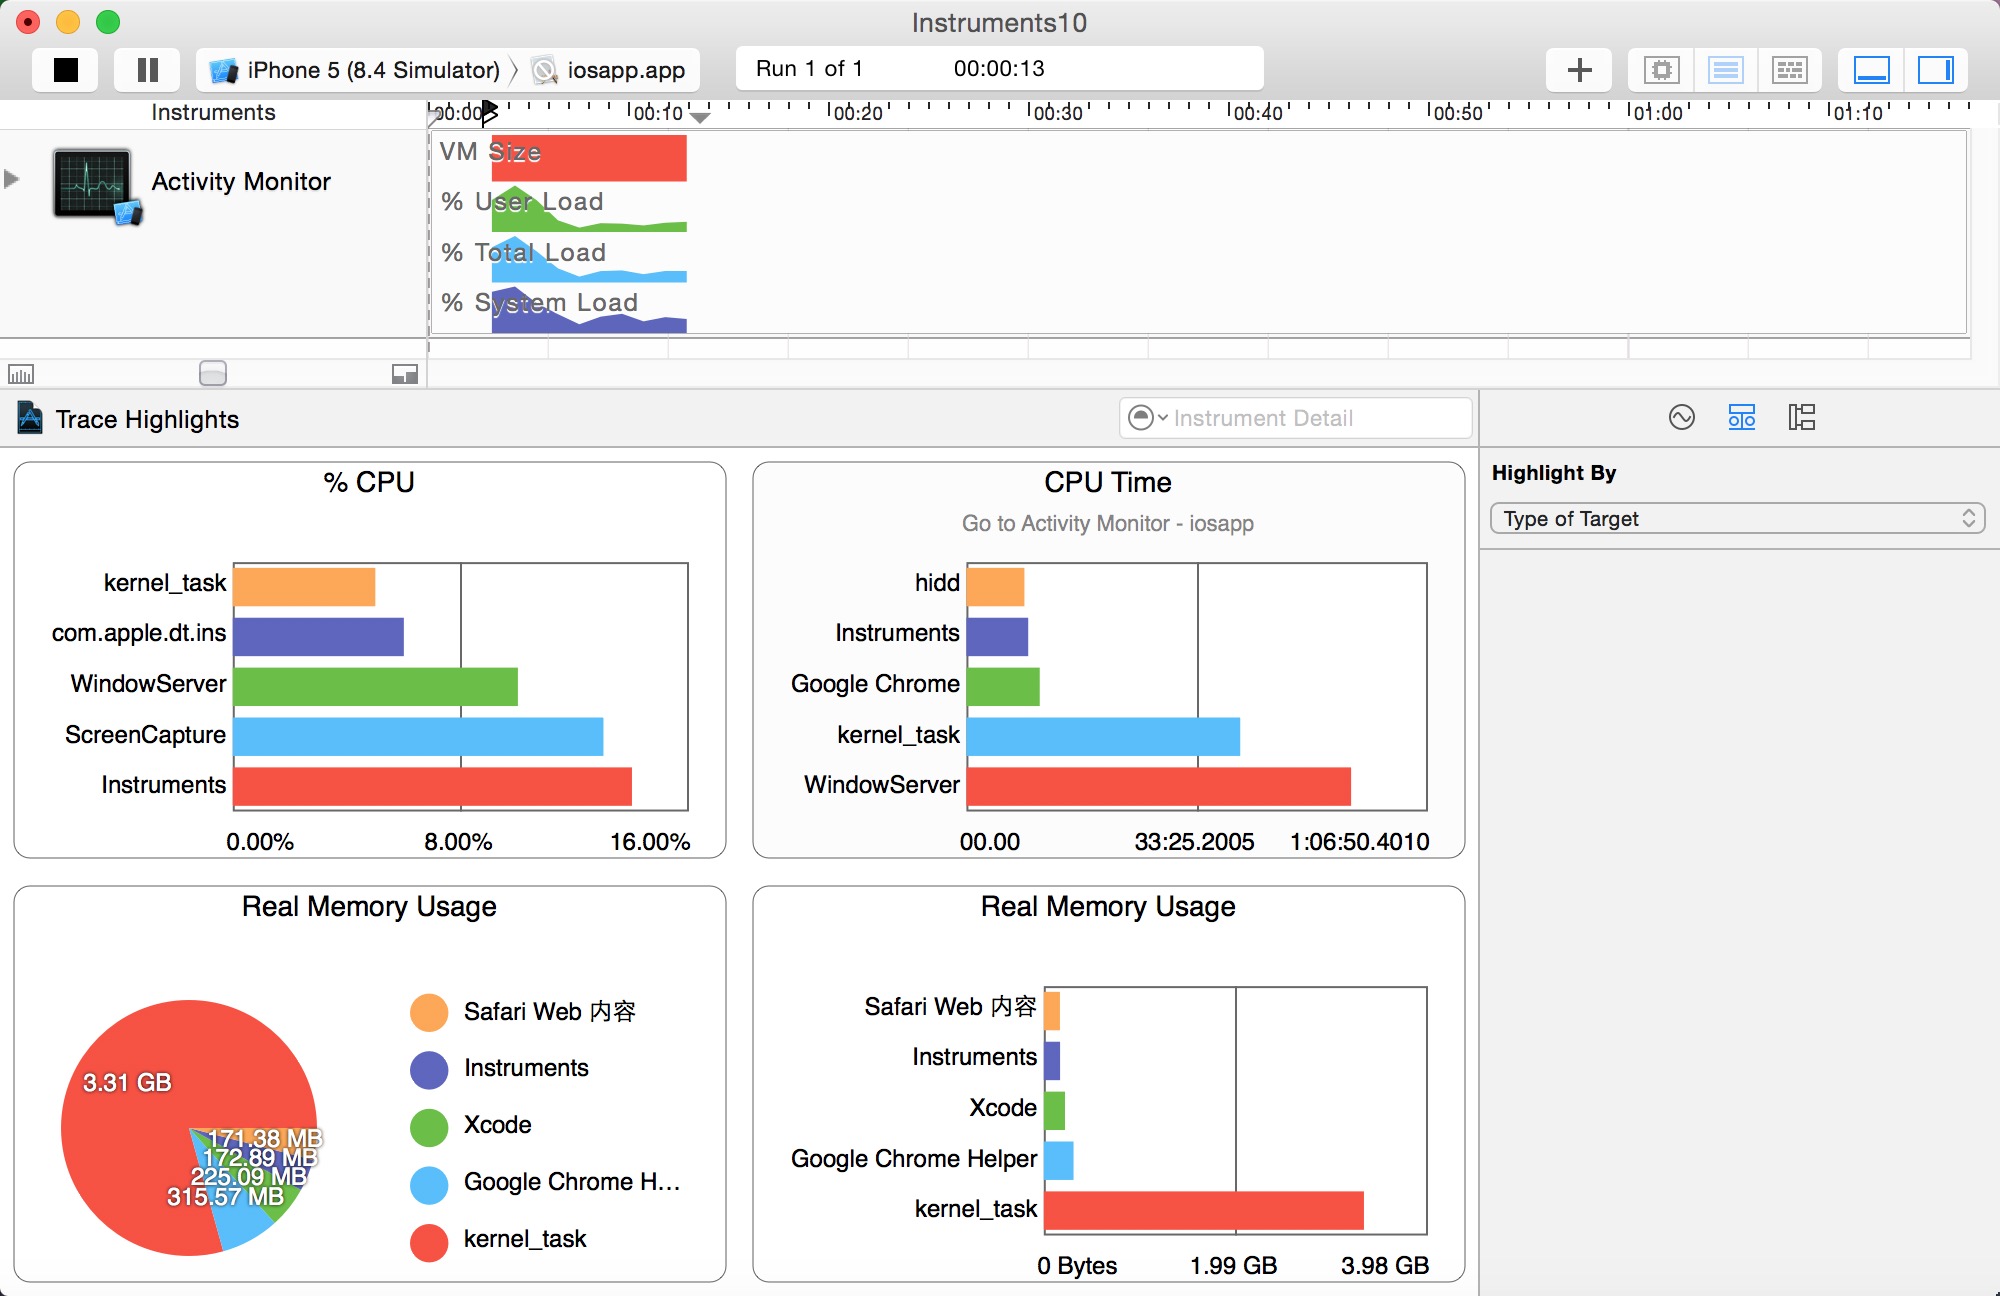
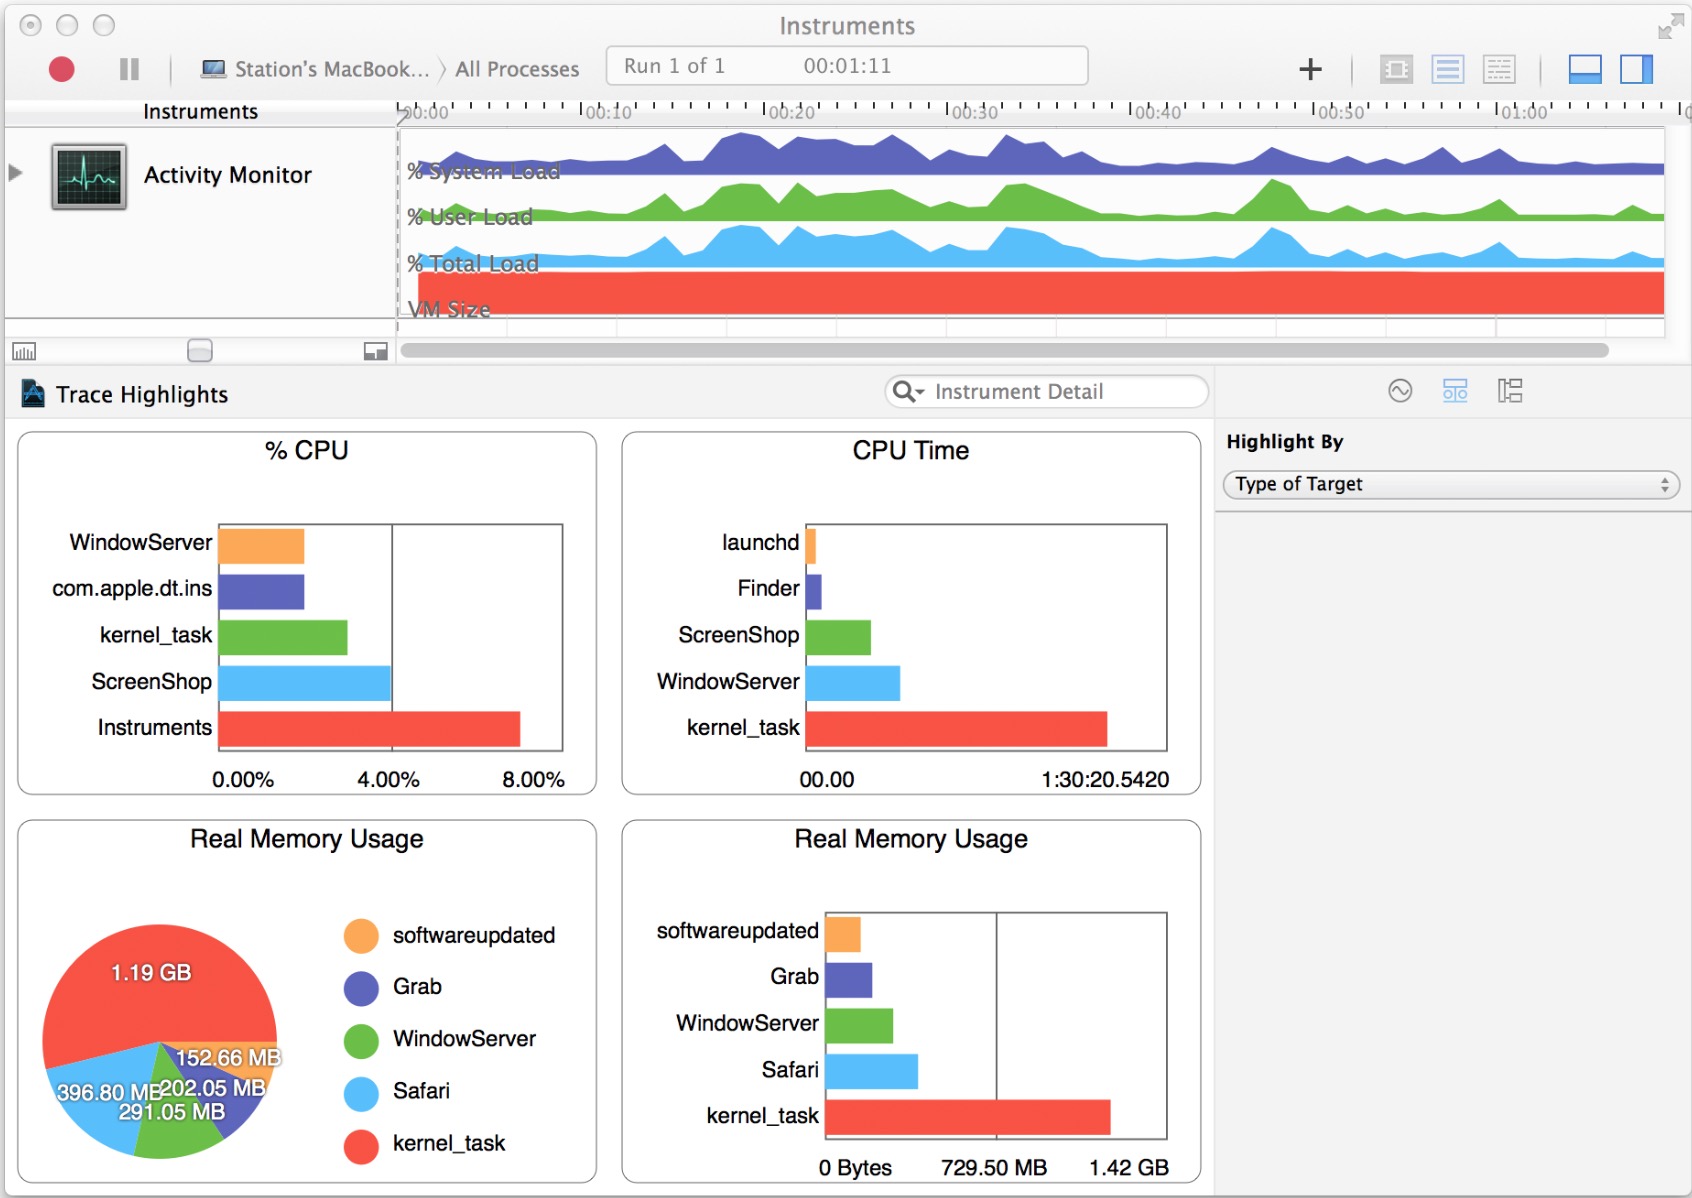
The Activity Monitor instrument captures information about the load on the system measured against the virtual memory size. It can record information from a single process or from all processes running on the system. The Activity Monitor instrument provides you with four convenient charts for a quick, visual representation of the collected information. The two charts that specifically describe memory usage are:
Real Memory Usage (bar graph). Shows the top five real memory users in a bar graph.
Real Memory Usage (pie chart). Shows the top five real memory users with the total memory used displayed.
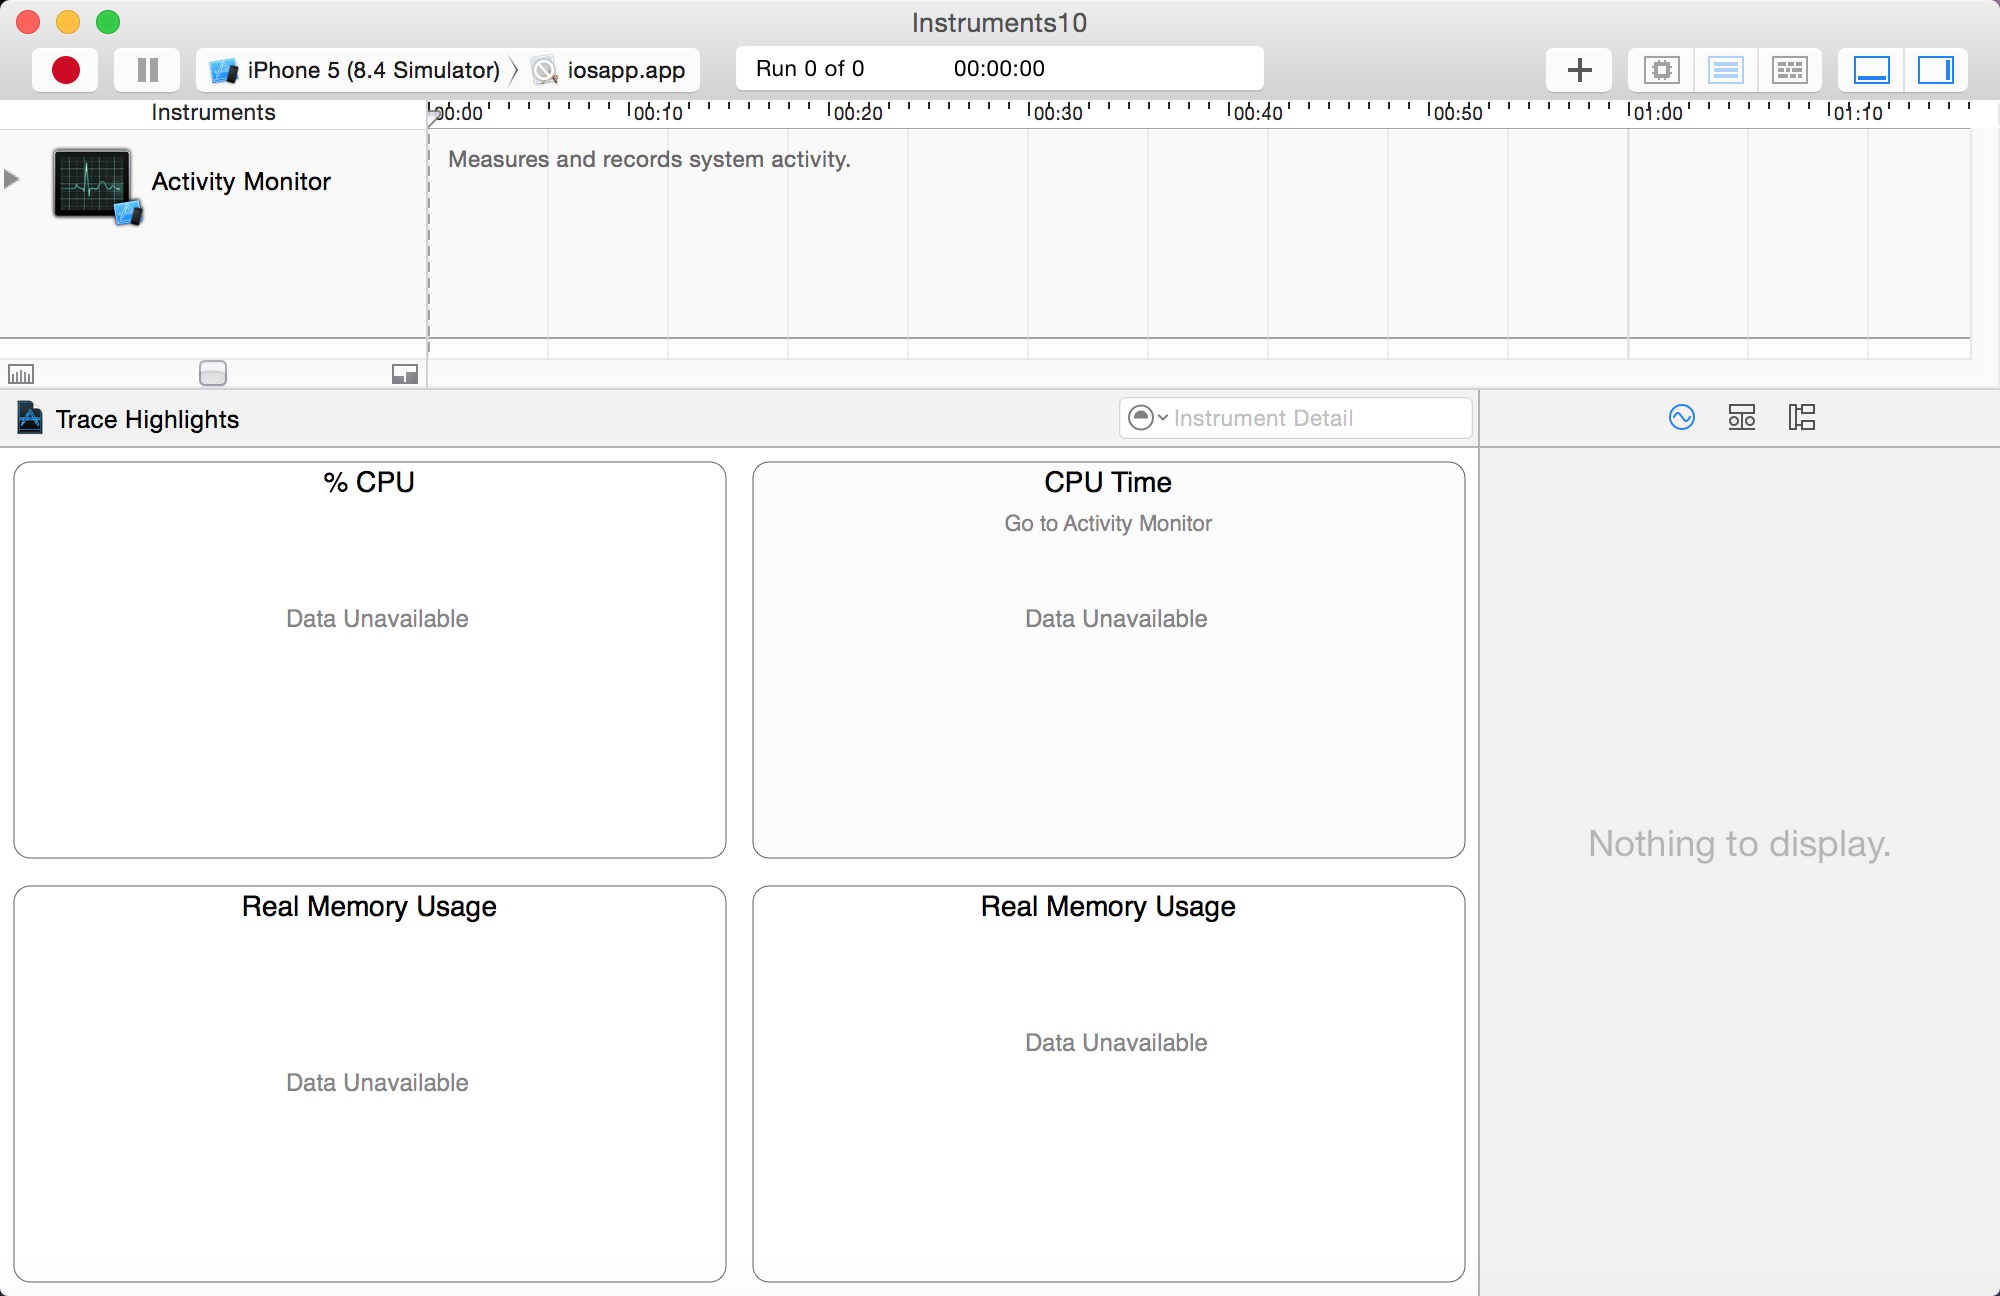
下图为Activity Monitor instrument with charts
The Record Settings area in the inspector sidebar includes a list of system statistics, which can be configured to appear in the track pane and graphically represent collected data. Select a statistic’s checkbox to see it graphed in the track pane. Click the shape or the color well to change how a statistic appears in the track pane.
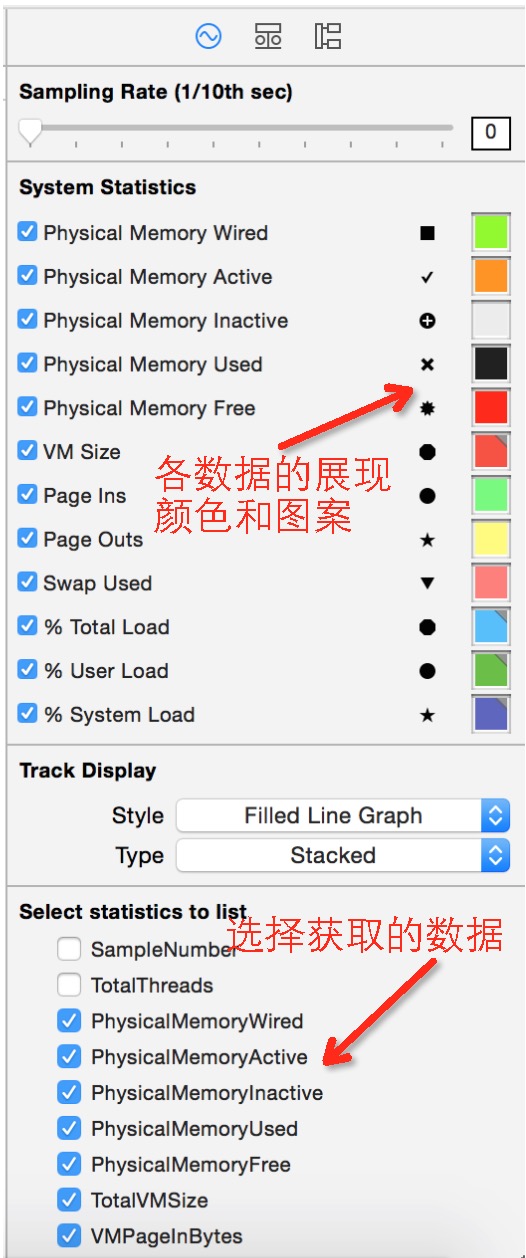
There are a number of statistics the Activity Monitor instrument supports, but the following ones are memory-specific:
Physical Memory Wired
Physical Memory Active
Physical Memory Inactive
Physical Memory Used
Physical Memory Free
Total VM Size
VM Page In Bytes
VM Page Out Bytes
VM Swap Used
If one of the statistics above doesn’t appear under System Statistics, locate it under “Select statistics to list” and click its checkbox to include it in the list.
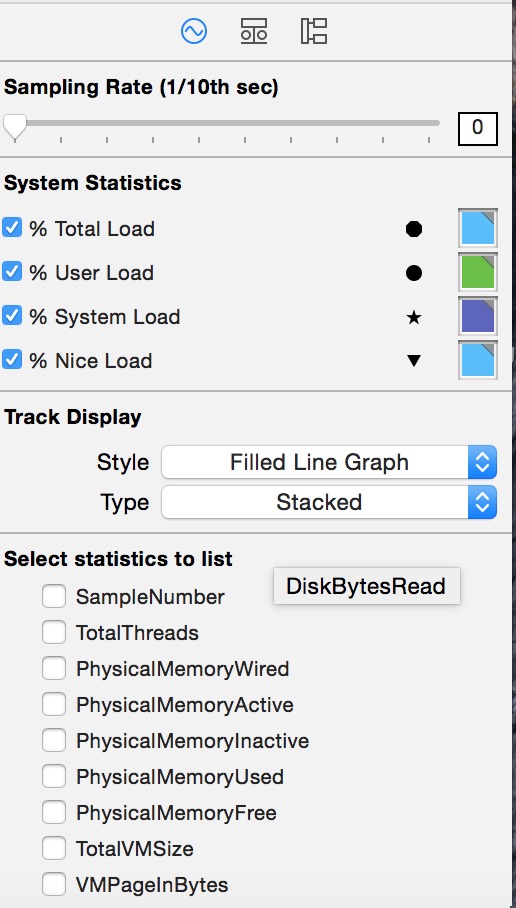
CPUTtotalLoad
CPUUserLoad
CPUSystemLoad
CPUNiceLoad
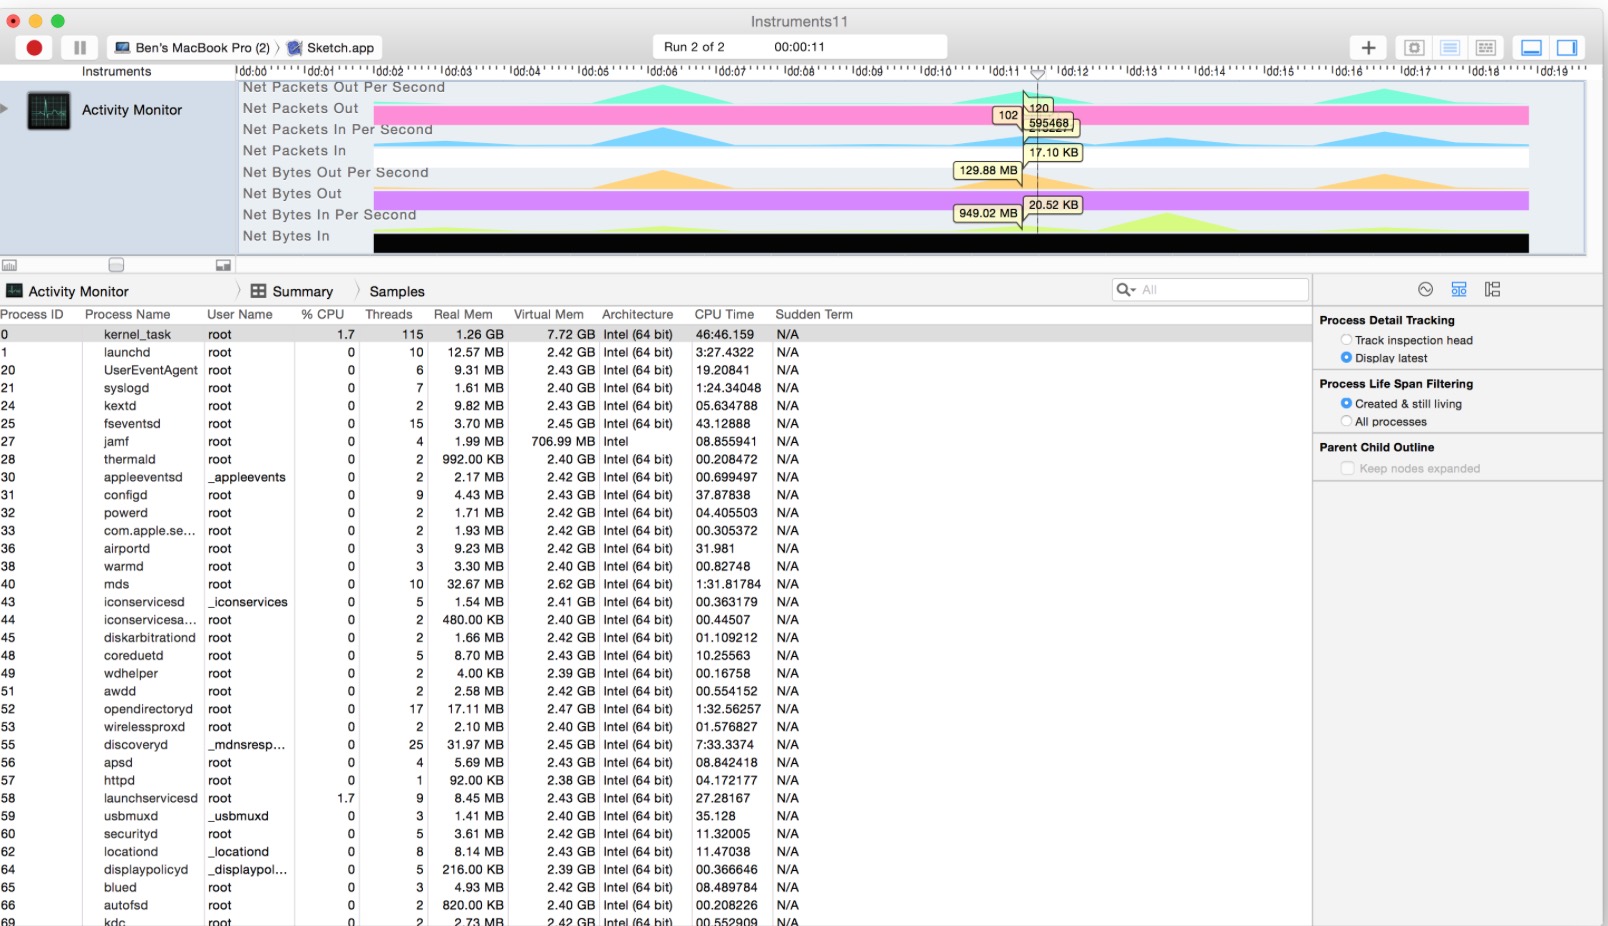
By default, the Activity Monitor template isn’t set up to display network activity. Therefore, you need to enable the desired network-related statistics in the Record Settings area in the inspector sidebar for the Activity Monitor instrument to see which processes are sending and receiving information.
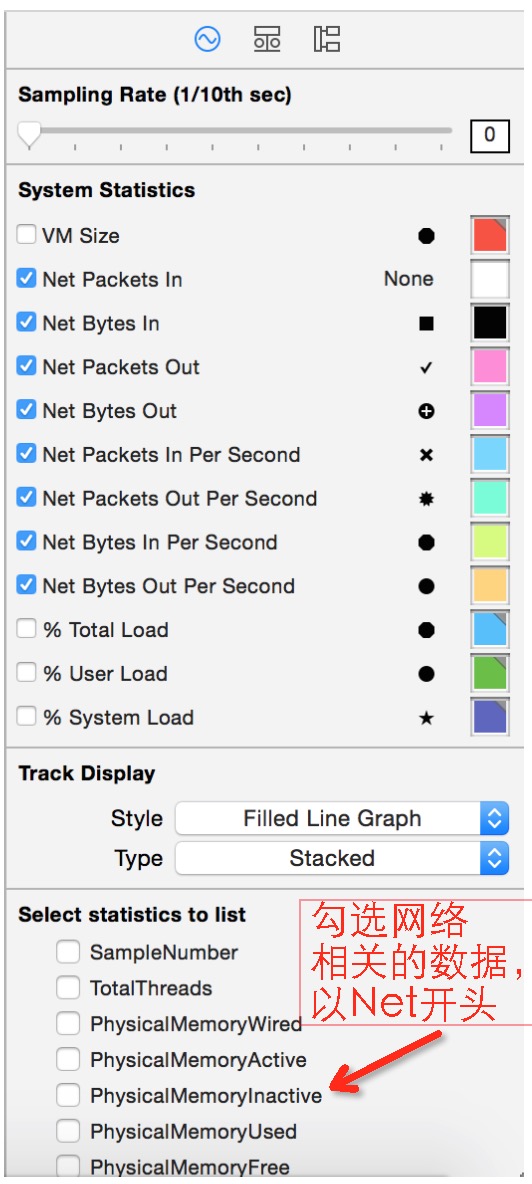
There are a number of statistics the Activity Monitor instrument supports, but the following ones are network-specific:
Net Packets In
Net Bytes In
Net Packets Out
Net Bytes Out
Net Packets In Per Second
Net Packets Out Per Second
Net Bytes In Per Second
Net Bytes Out Per Second
If one of the statistics above doesn’t appear under System Statistics in the Record Settings inspector, locate it under “Select statistics to list” and click its checkbox to include it in the list.
Once you have gathered network activity for your app, examine it carefully to pinpoint areas where your app is sending out excessive amounts of information and therefore tying up valuable device resources. When you minimize the amount of information sent and received, you can benefit from increased performance and response times in your app.
下图为Activity Monitor instrument tracing network packets