https://blog.csdn.net/qq_36317804/article/details/103288642
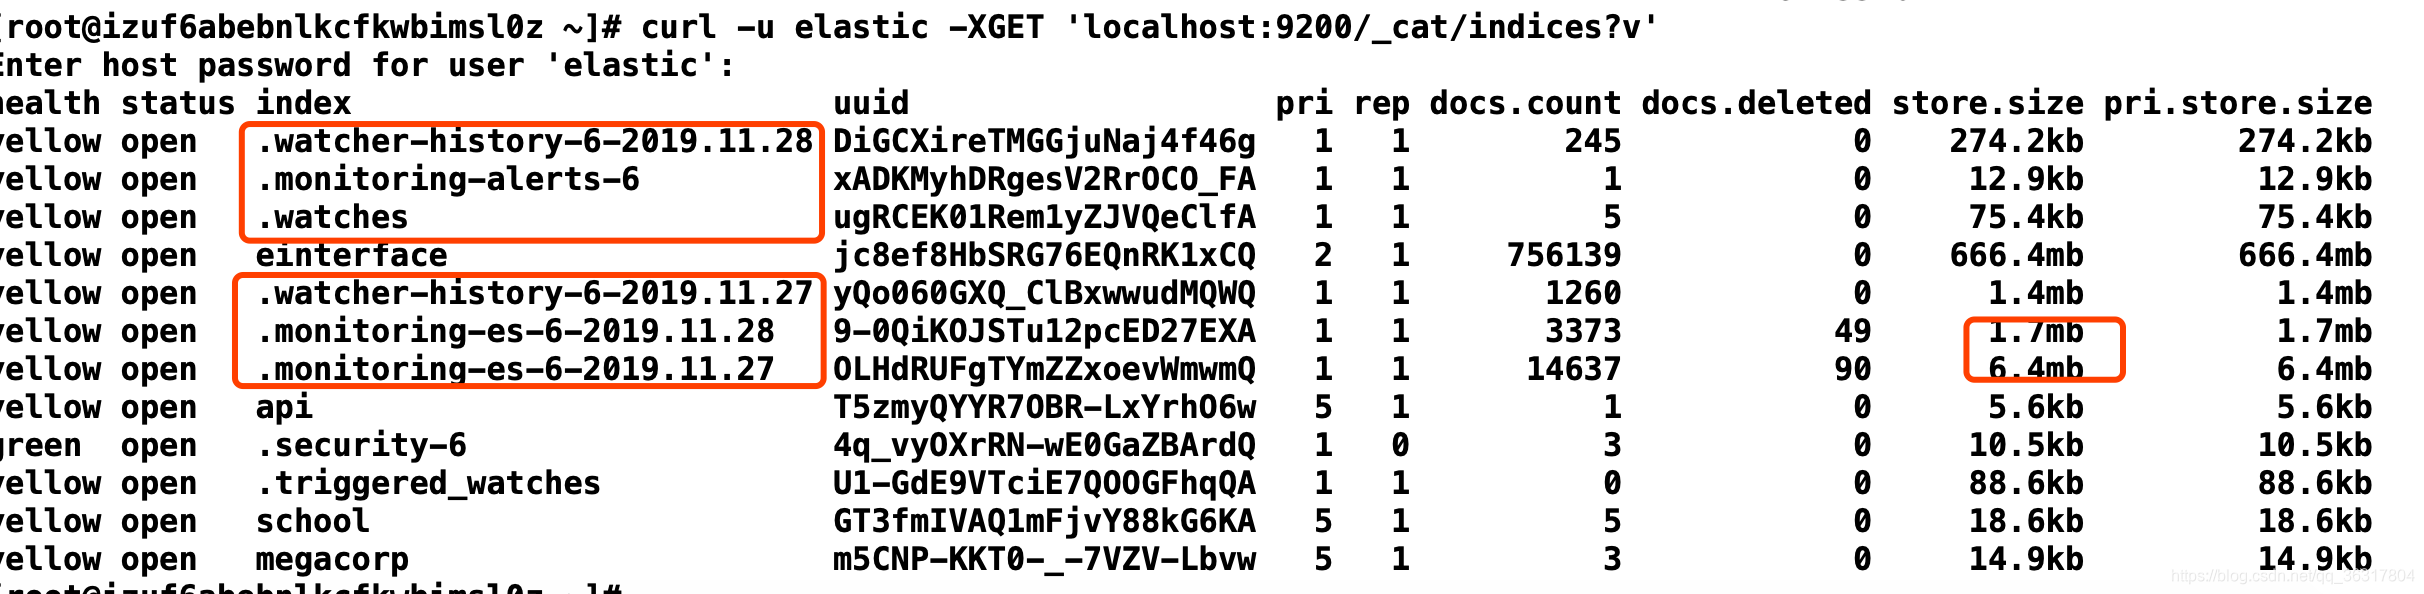
最近发现磁盘的占用率趋高,打开可视化工具head查看了之后发现,es实例中生成了好多类似monitoring-es-6-2019.11.27这个的节点。
##查询集群总的磁盘使用情况
curl -u elastic -XGET 'localhost:9200/_cat/allocation?v'

##查询集群中各索引的磁盘占用情况
curl -u elastic -XGET 'localhost:9200/_cat/indices?v'
- 1
- 2
- 3
- 4
- 5
ES服务安装了x-pack之后,会默认保留最近7天的监控索引,此类.monitoring-es-6-*的索引会占用ES实例存储空间。索引的大小跟集群中索引个数(包含系统索引)节点个数有关系,为了避免ES实例大部分空间被监控索引所占用,可通过一下两种方式优化:
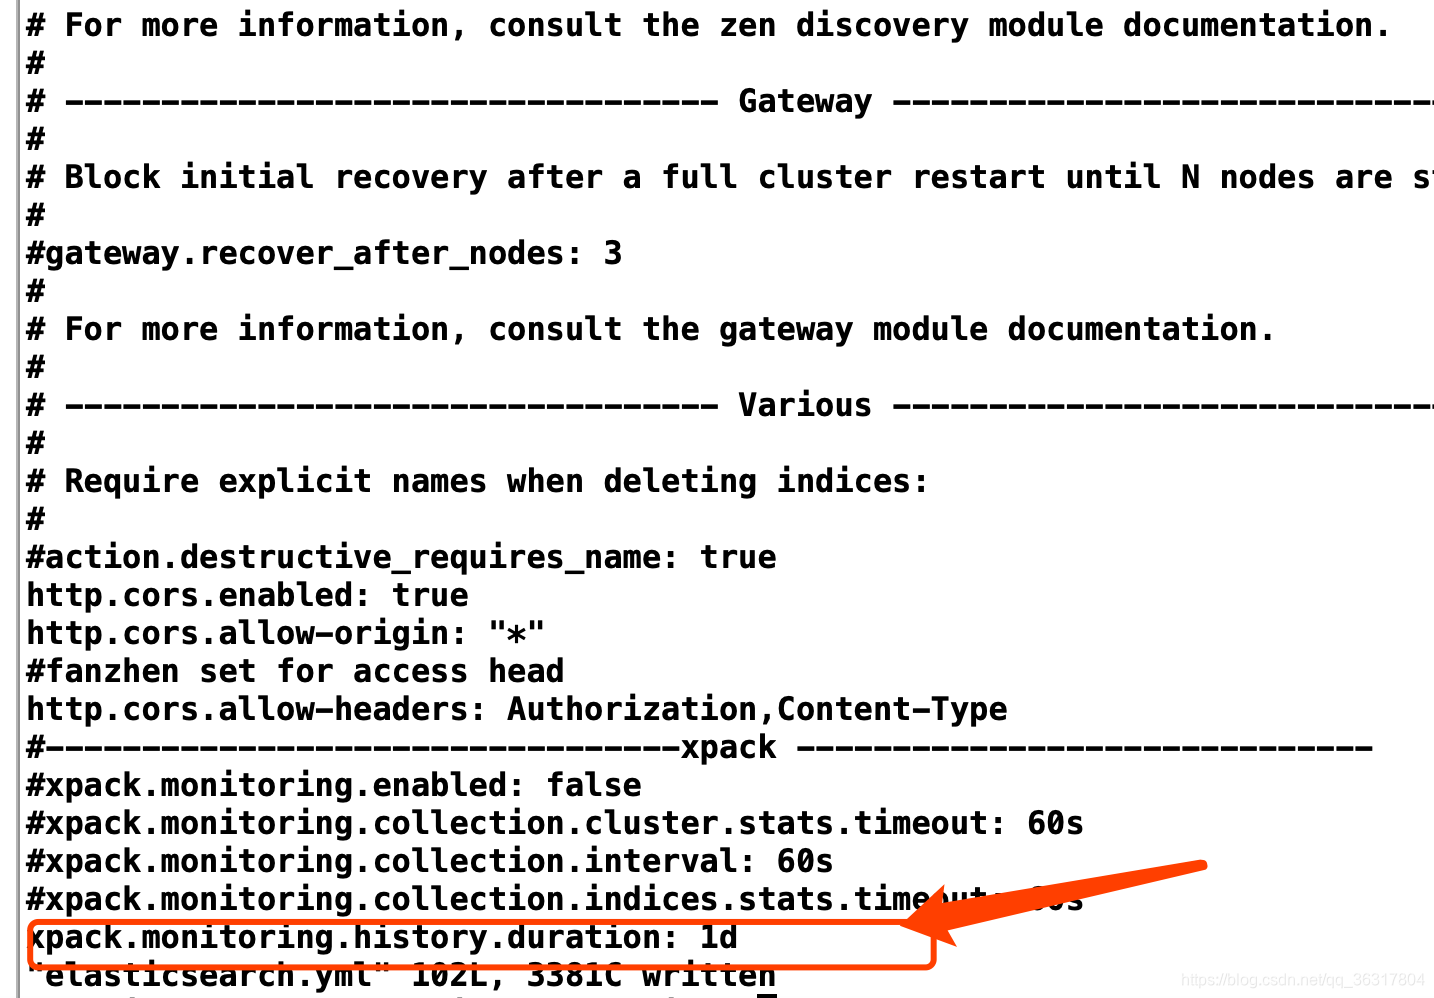
- 一、通过修改elasticsearch.yml的配置设置监控索引保留天数
xpack.monitoring.history.duration: 1d
- 1
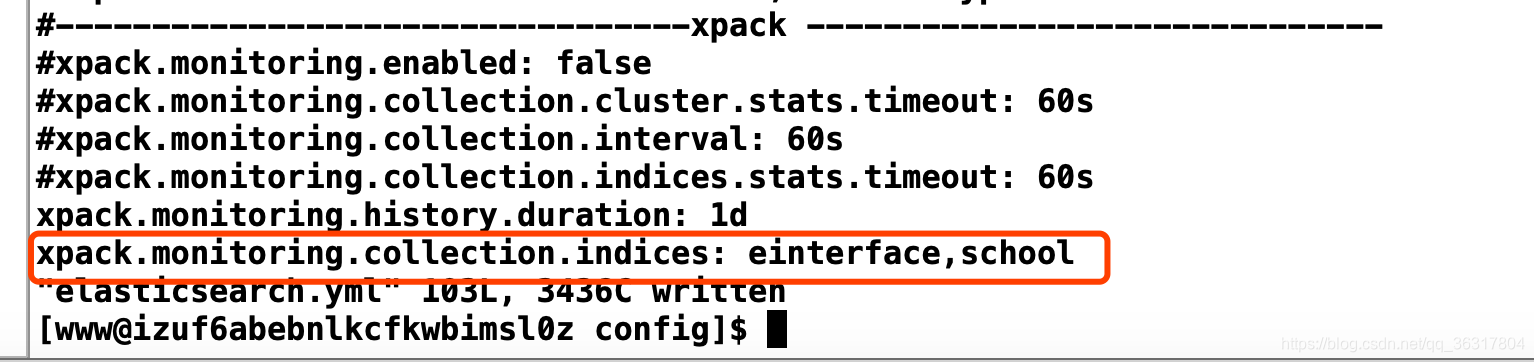
- 二、设置需要采集监控的索引
可以通过配置文件的设置,选择哪些索引需要监控,哪些索引不需要监控,以减少.monitoring-es-6-* 索引所占用磁盘空间。
 只监控einterface,和school索引。
 xpack.monitoring.collection.indices: einterface,school
- 1
- 2
三、下面整理了一些可配置的参数
一般监控设置
xpack.monitoring.enabled
设置为false在节点上禁用Elasticsearch的Elasticsearch X-Pack监视。监控收集设置
这些xpack.monitoring.collection设置控制如何从Elasticsearch节点收集数据。xpack.monitoring.collection.cluster.stats.timeout
设置收集群集统计信息的超时时间。默认为10s。xpack.monitoring.collection.indices
控制Monitoring从哪个指标收集数据。默认为所有的索引。例如,将索引名称指定为以逗号分隔的列表moma,momb,momc。名称支持通配符的设置如包含通配符mom*,还可以通过+包含索引,-排除索引。xpack.monitoring.collection.index.stats.timeout
设置收集索引统计信息的超时时间。默认为10s。xpack.monitoring.collection.indices.stats.timeout
设置收集总索引统计信息的超时时间。默认为10s。xpack.monitoring.collection.index.recovery.active_only
控制是否收集所有的回收率。设置为true仅收集主动恢复。默认为false。xpack.monitoring.collection.index.recovery.timeout
设置收集恢复信息的超时时间。默认为10s。xpack.monitoring.collection.interval
控制收集数据样本的频率。默认为10s。如果修改收集时间间隔,请将该xpack.monitoring.min_interval_seconds 选项设置kibana.yml为相同的值。设置为-1暂时禁用数据收集。您可以通过群集更新设置API更新此设置。xpack.monitoring.history.duration
设置保留持续时间,自动删除由监控导出器创建的索引。默认为7d(7天),做少设置成1d(1天)- 在阿里云上面也对文件进行了详细的设计
- https://blog.csdn.net/qq_36317804/article/details/103288642
背景信息
默认情况下,X-Pack监控客户端会每隔10s采集一次集群的监控信息,并保存到对应阿里云ES实例的以.monitoring-*为前缀的索引中。
目前主要有.monitoring-es-6-*和.monitoring-kibana-6-*这两种索引,以天为单位滚动创建。采集完的信息会保存在以.monitoring-es-6-为前缀,以当前日期为后缀的索引中。
其中.monitoring-es-6-*索引占用磁盘空间较大,主要存放了集群状态、集群统计、节点统计、索引统计等信息。
操作步骤
- 登录对应阿里云ES实例的Kibana控制台。登录控制台的具体步骤请参见登录Kibana控制台。
- 在左侧导航栏,单击Monitoring。
- 在Elasticsearch区域,单击Indices。

- 在Indices页签,开启System indices,查看监控索引所占的空间大小。

- 在左侧导航栏,单击Dev Tools(开发工具)。
- 在Console中,执行以下命令配置监控索引。系统默认保留最近7天的监控索引,此类监控索引(
.monitoring-es-6-*)会占用阿里云ES实例的存储空间。索引的大小与实例中的索引个数(包含系统索引)和节点个数有关系。为了避免实例的大部分空间被监控索引占用,可通过以下两种方式进行优化(实际使用中,可以将以上两种方案结合使用):- 设置监控索引的保留天数。
PUT _cluster/settings
{"persistent": {"xpack.monitoring.history.duration":"1d"}}
您可以按照需求自定义监控索引的保留天数,最少保留一天。
- 设置需要采集的监控索引。 通过调用API设置哪些索引需要监控以及哪些索引不需要监控,以减少
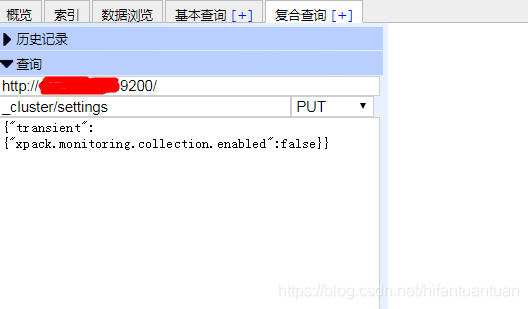
.monitoring-es-6-*索引所占用的磁盘空间。以下命令以禁掉采集系统索引为例。PUT _cluster/settings {"persistent": {"xpack.monitoring.collection.indices": "*,-.*"}}说明 禁掉的索引监控信息将不会在Kibana控制台的Montioring页面(索引列表及索引监控信息页面)中显示。但是会在GET _cat/indices获取的索引列表中显示,并且可查看索引的状态是open还是close。1.在head中执行
- {
- "transient": {
- "xpack.monitoring.collection.enabled": false
- }
- }
2.命令删除 已生成的索引
curl -XDELETE 'http://1localhost:9200/.monitoring-es-6-*
- 设置监控索引的保留天数。